TINTOlib · Synthetic Images · Tabular Data
TINTO vs REFINED vs IGTD
A methodological comparison of three representative tabular data into synthetic image methods for generating synthetic images from structured data.
Tutorial metadata
- Author: Manuel Castillo-Cara, PhD
- Affiliation: Dpt. of Artificial Intelligence, Universidad Nacional de Educación a Distancia (UNED), Spain
- Role: Researcher, Professor, and TINTOlib Python Library Developer
- License: CC BY-NC 4.0 unless otherwise stated.
The challenge of organizing tabular space
As discussed in previous posts, applying computer vision architectures —such as Convolutional Neural Networks (CNNs) or Vision Transformers (ViTs)— to classical tabular datasets is not straightforward. The main reason is methodological: tabular data do not have an intrinsic spatial structure.
In natural images, neighbouring pixels usually encode meaningful local relationships: edges, textures, shapes or spatial continuity. In tabular data, however, the order of the columns is often arbitrary. If we simply reshape a row of numerical values into a square matrix, we are imposing a spatial topology that may not correspond to any real relationship among the original variables.
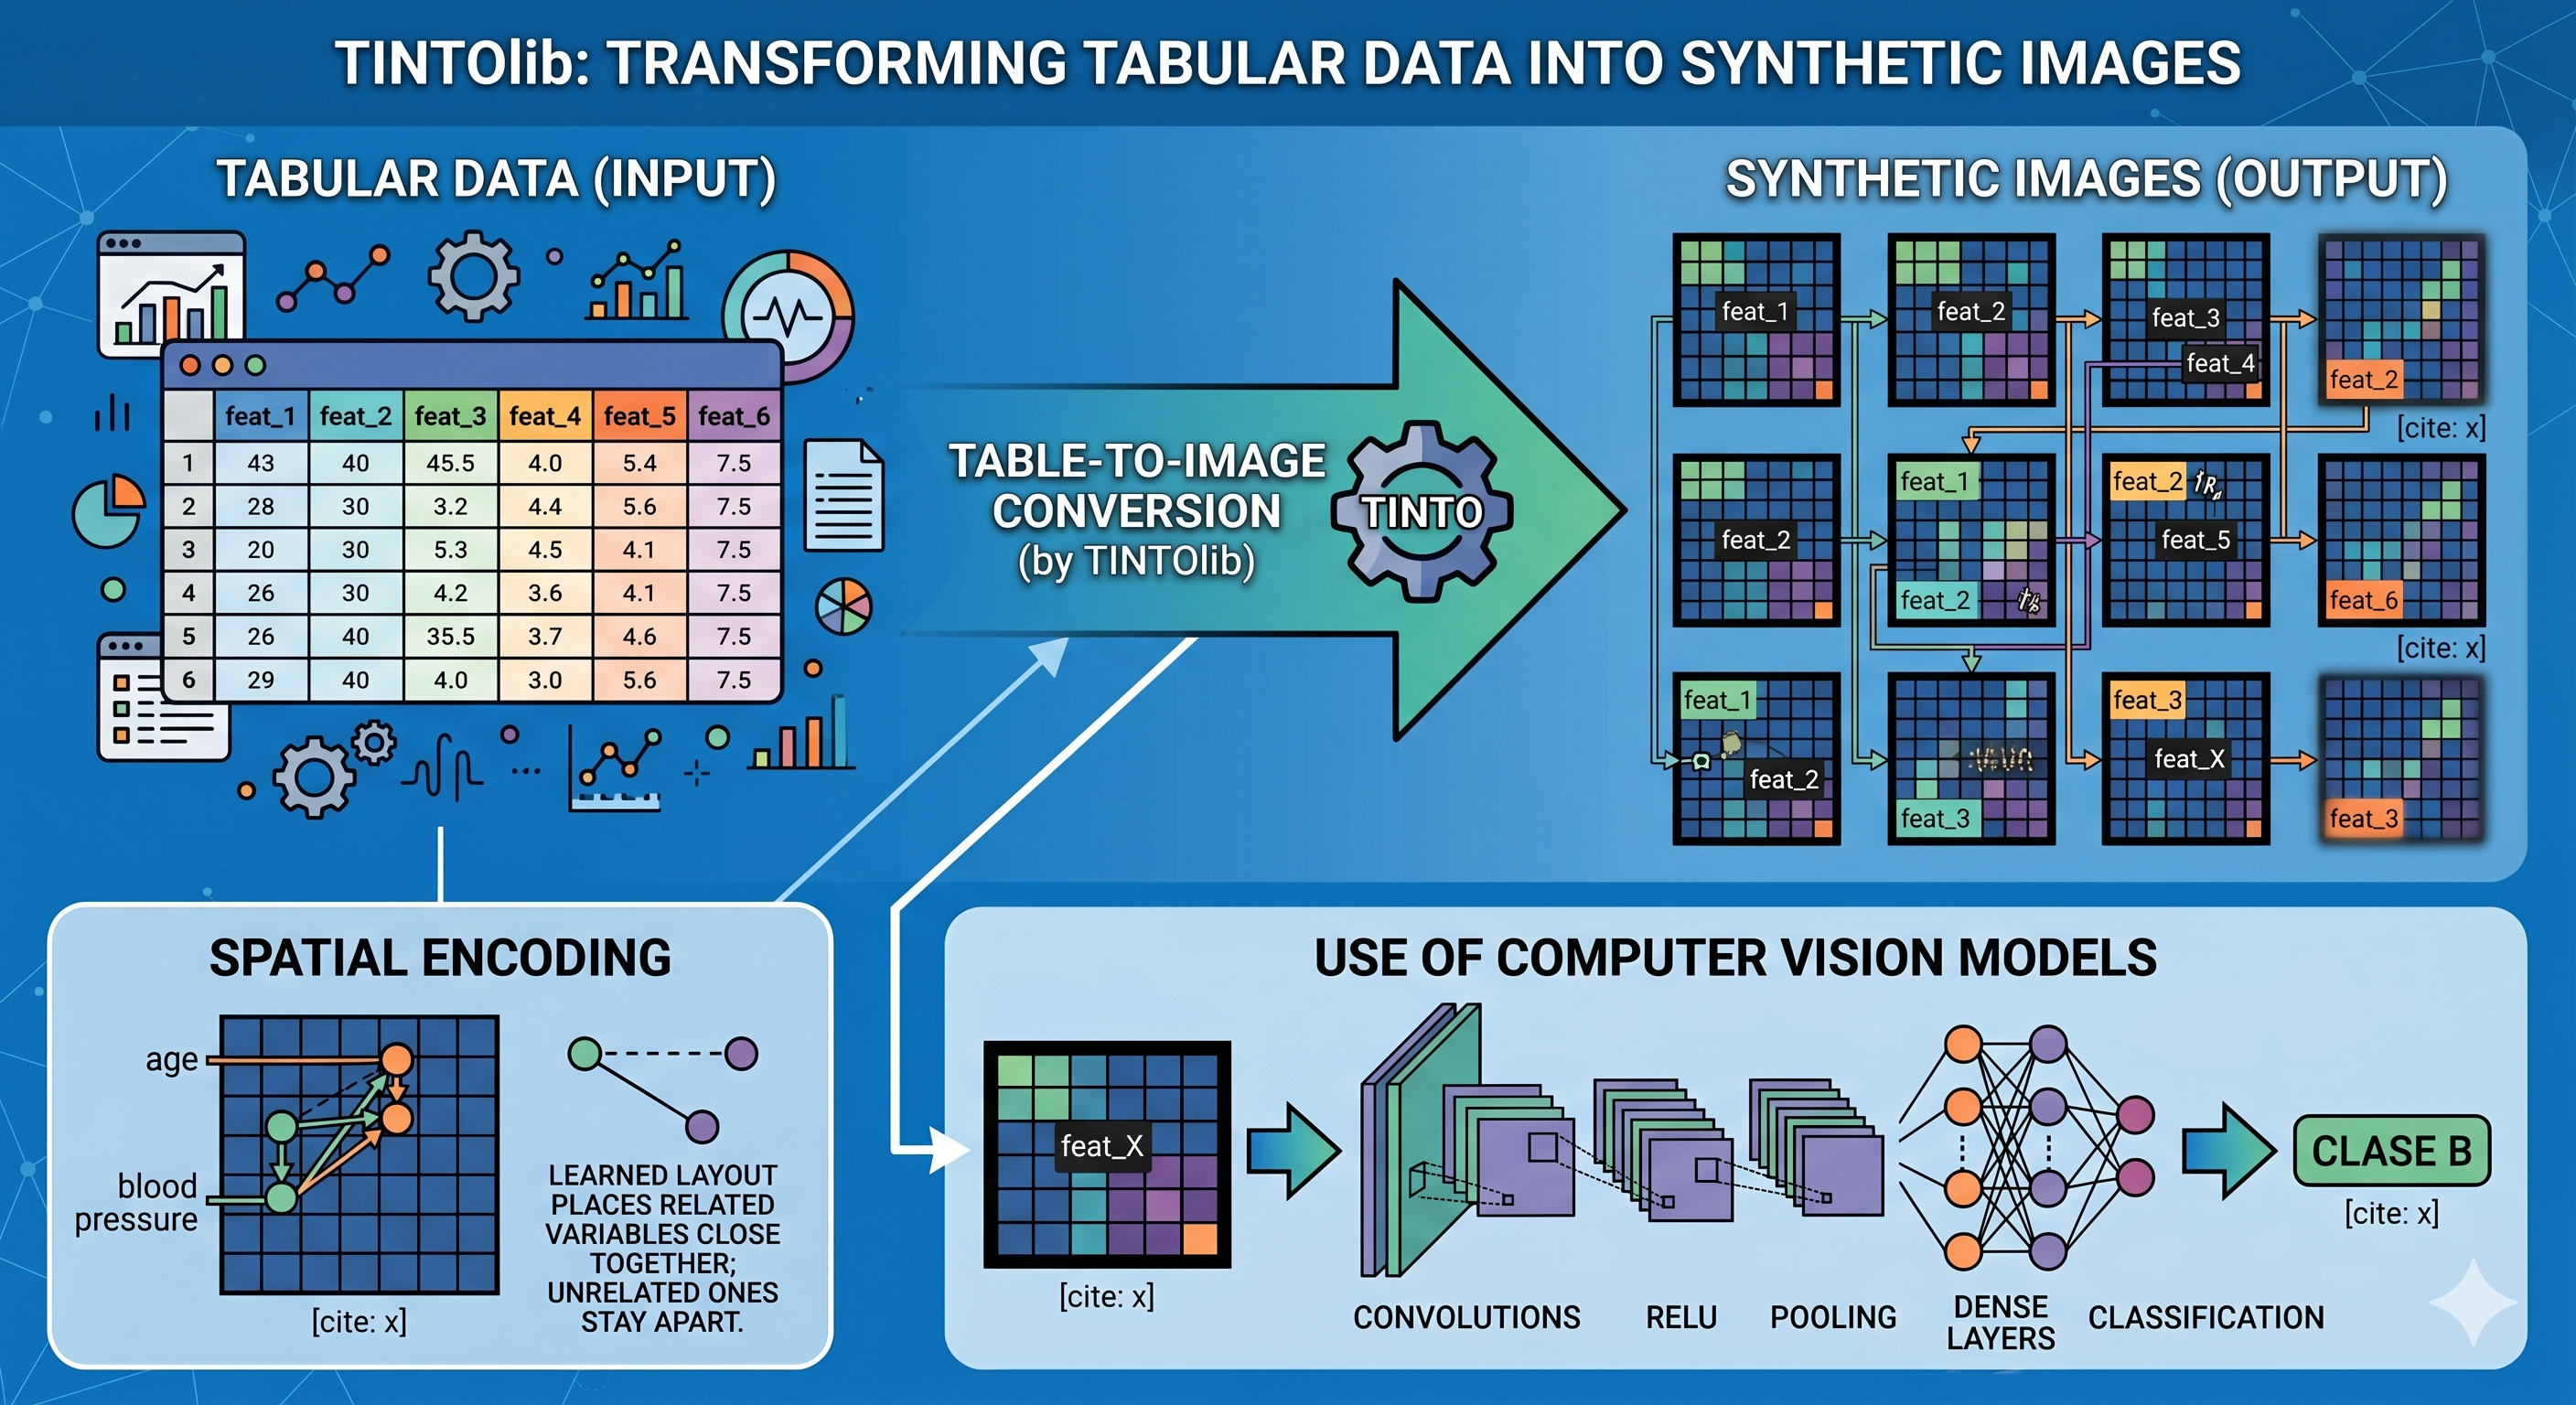
This is precisely the problem addressed by tabular data into synthetic image transformation methods. These algorithms aim to arrange tabular features on a two-dimensional grid so that spatial proximity reflects some form of statistical, geometric or relational similarity among variables.
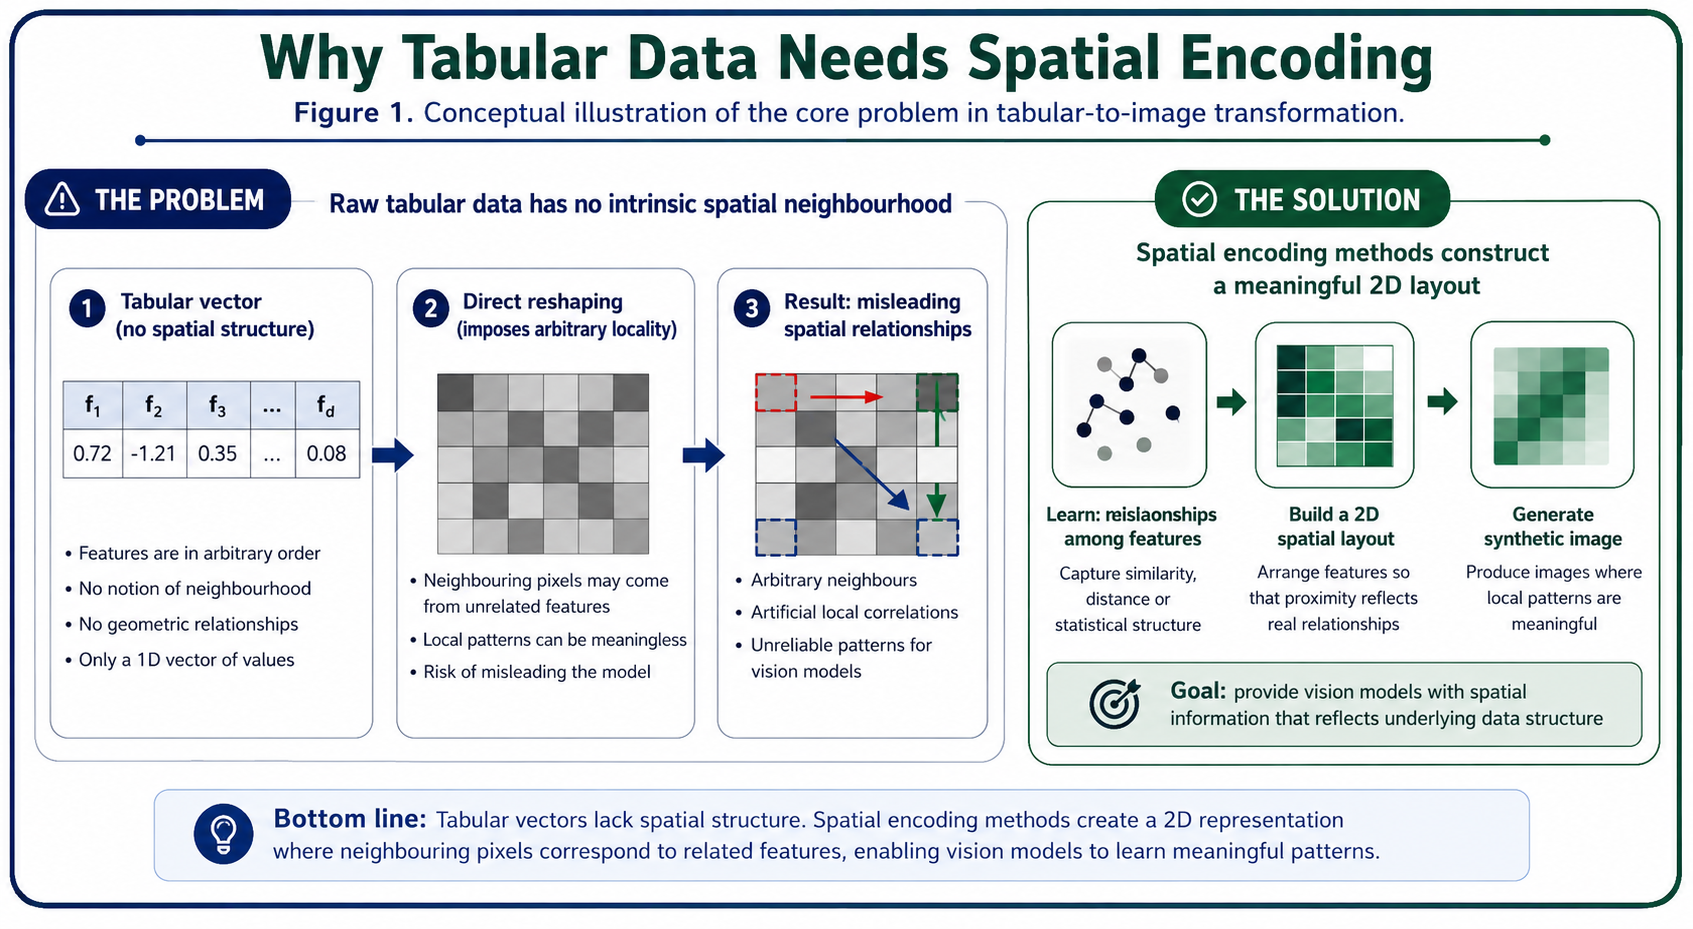 (Figure 1. Conceptual illustration of the core problem in tabular data into synthetic image transformation. A raw tabular vector has no intrinsic spatial neighbourhood, so directly reshaping it into a matrix may impose arbitrary local relationships. Spatial encoding methods aim to construct a more meaningful two-dimensional layout before applying vision-based models.)
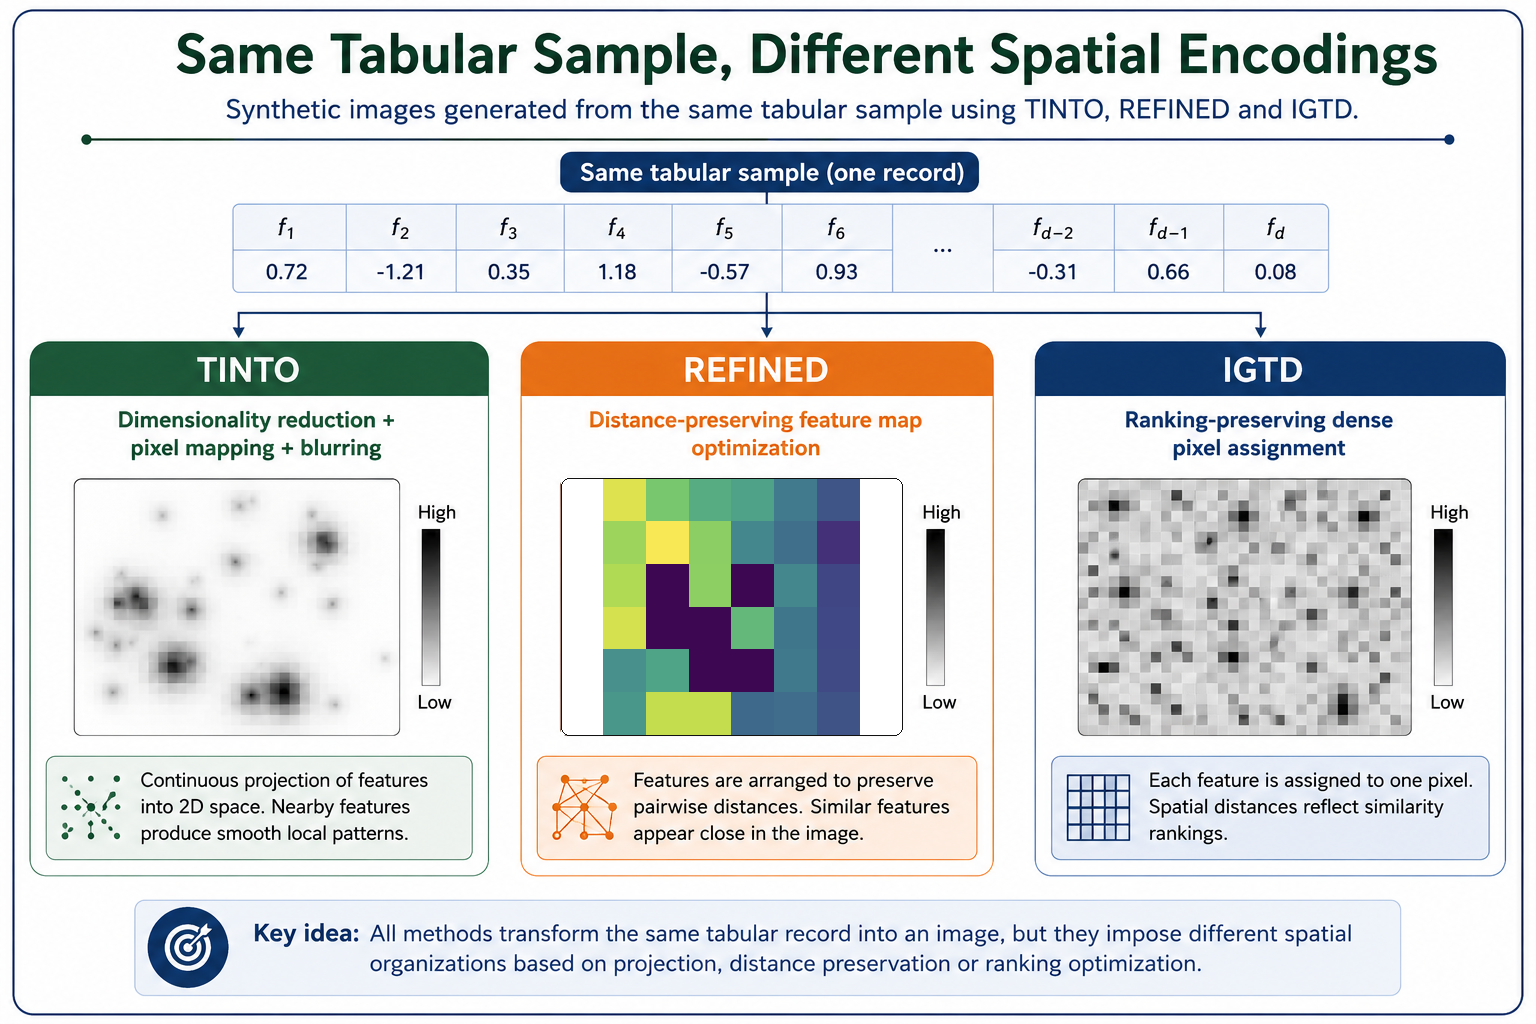
In this post, we compare three representative methods implemented in TINTOlib:
- TINTO, based on dimensionality reduction and optional blurring.
- REFINED, based on distance-preserving geometric optimization.
- IGTD, based on preserving the ranking of feature relationships in a dense image layout.
The objective is not to claim that one method is universally superior, but to understand their different assumptions, strengths, computational costs and practical use cases.
(Figure 2. Synthetic image representations generated from the same tabular sample using TINTO, REFINED and IGTD. Although all three methods pursue the same objective —constructing a spatial representation from tabular features— they produce different image topologies due to their distinct optimization criteria and spatial encoding assumptions.)
1. TINTO: dimensionality reduction and blurring
TINTO addresses the tabular data into synthetic image problem by projecting the features of the dataset into a two-dimensional space using dimensionality-reduction techniques such as PCA or t-SNE. Once the features have been located in a continuous coordinate space, their positions are mapped to a discrete image grid.
How it works
The general workflow followed by TINTO can be summarized as follows:
- A feature-level representation is constructed from the original tabular dataset.
- Dimensionality reduction is applied to obtain two-dimensional coordinates for the features.
- These coordinates are scaled and mapped onto an image grid of size (N \times N).
- Each tabular sample is converted into an image by placing the feature values in their corresponding spatial positions.
- Optional blurring is applied to diffuse feature intensities across neighbouring pixels.
The blurring step is particularly relevant. When two or more features are projected into nearby or overlapping coordinates, direct pixel assignment can produce sparse or unstable representations. Blurring spreads the feature intensity over local neighbourhoods, creating smoother synthetic images and making local patterns more accessible to convolutional filters.
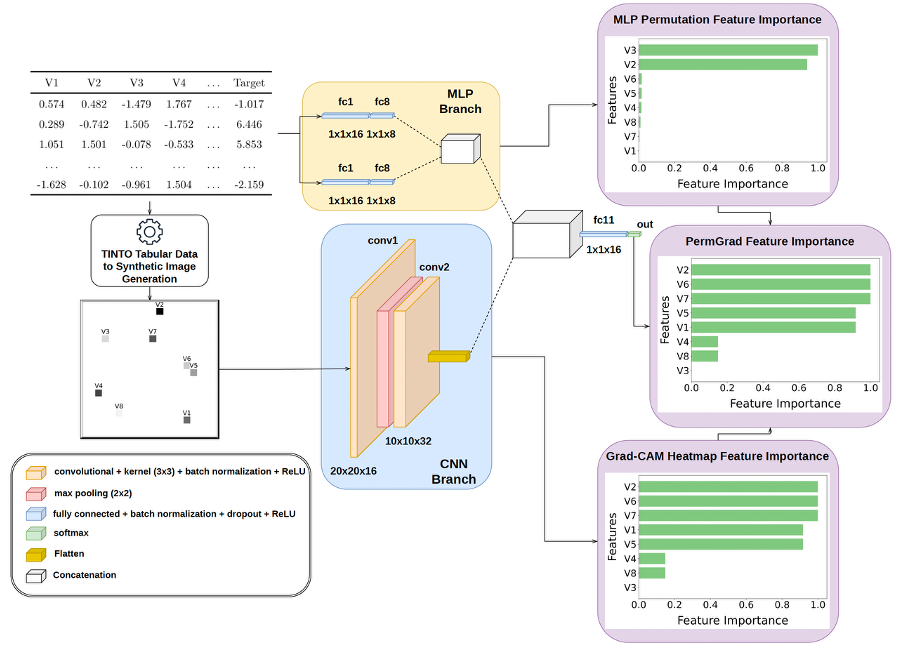
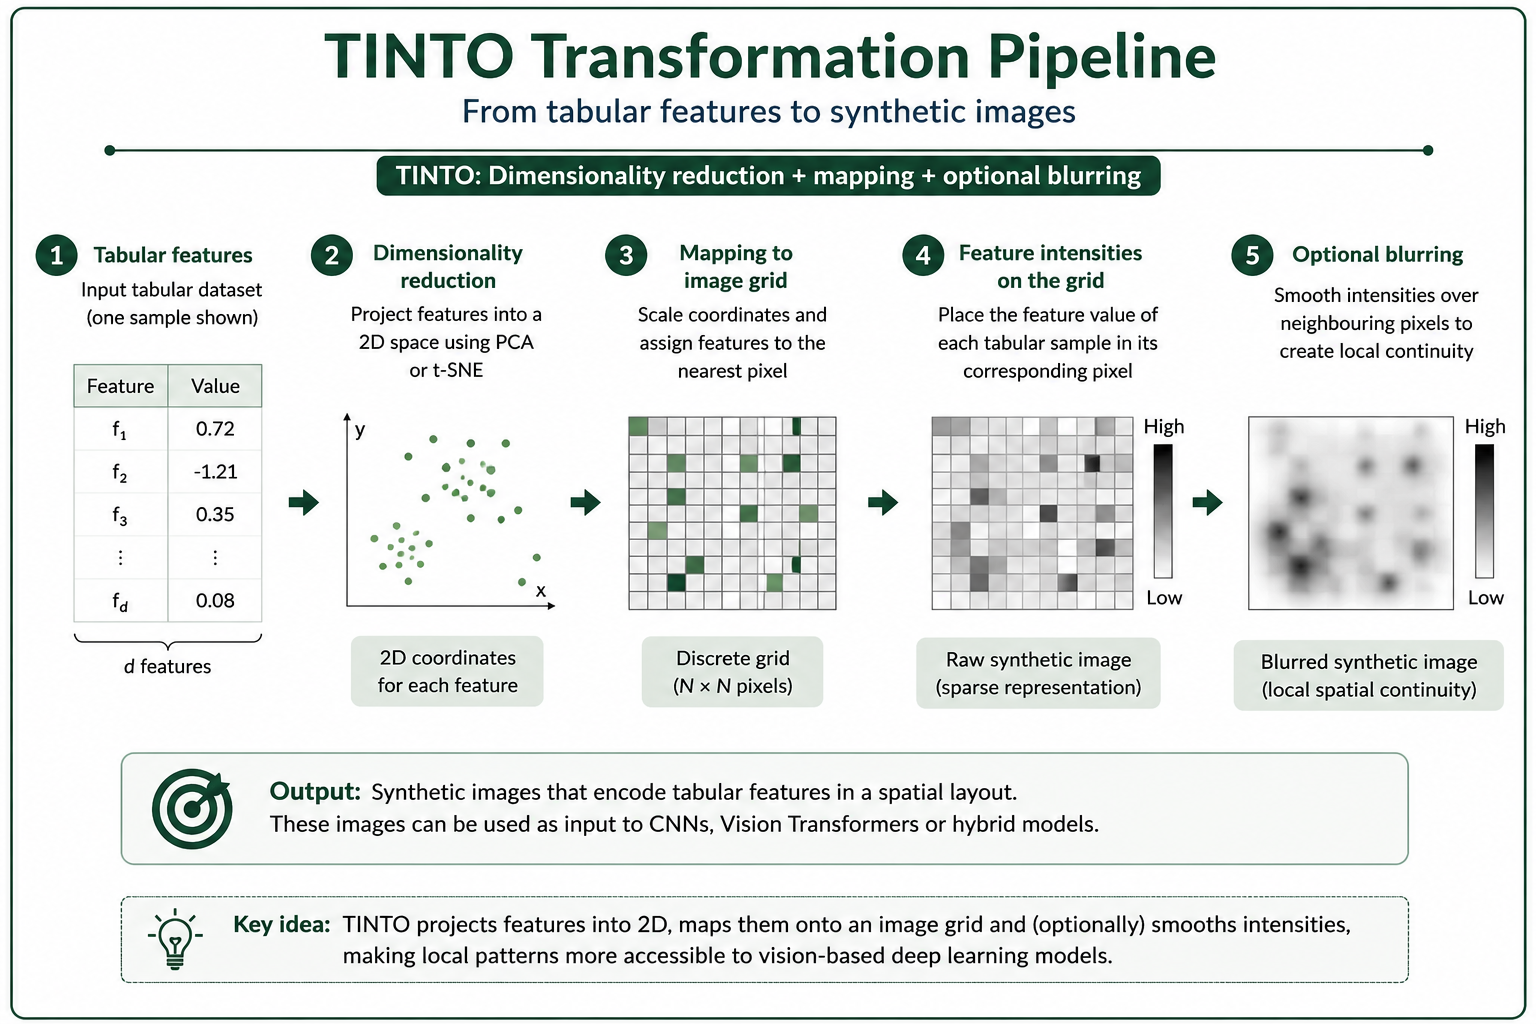 (Figure 3. TINTO transformation pipeline. Features are projected into a two-dimensional space using PCA or t-SNE, mapped onto a discrete image grid, and optionally smoothed through blurring to generate synthetic images with local spatial continuity.)
Strengths and limitations
TINTO is especially useful when the objective is to generate visually interpretable synthetic images and to experiment rapidly with different spatial configurations. It is flexible, relatively efficient, and well suited for hybrid neural architectures that combine the original tabular vector with the generated synthetic image.
However, the final representation depends on the selected dimensionality-reduction algorithm, the image size, the blurring configuration and the characteristics of the dataset. As with any tabular data into synthetic image method, these hyperparameters should be evaluated under a rigorous validation protocol.
2. REFINED: geometric mapping and neighbourhood dependencies
REFINED stands for REpresentation of Features as Images with NEighborhood Dependencies. It was originally proposed as a way to represent high-dimensional tabular data as images by preserving feature relationships in a spatial layout.
Unlike direct reshaping approaches, REFINED tries to construct a meaningful feature map where spatial proximity reflects similarity or dependency among variables. It has been especially influential in biomedical, chemical and omics-related datasets, where high-dimensional feature spaces are common.
How it works
A simplified REFINED workflow can be described as follows:
- A dissimilarity or distance matrix is computed among features.
- A dimensionality-reduction or multidimensional-scaling step is used to generate an initial two-dimensional feature map.
- An iterative optimization process adjusts the location of features on the grid.
- The objective is to preserve the original feature relationships as faithfully as possible in the image space.
- Each sample is converted into an image by filling the feature positions with the corresponding sample values.
The optimization process used by REFINED is more computationally demanding than a simple projection, but it can produce layouts that better preserve both local and global relationships among variables.
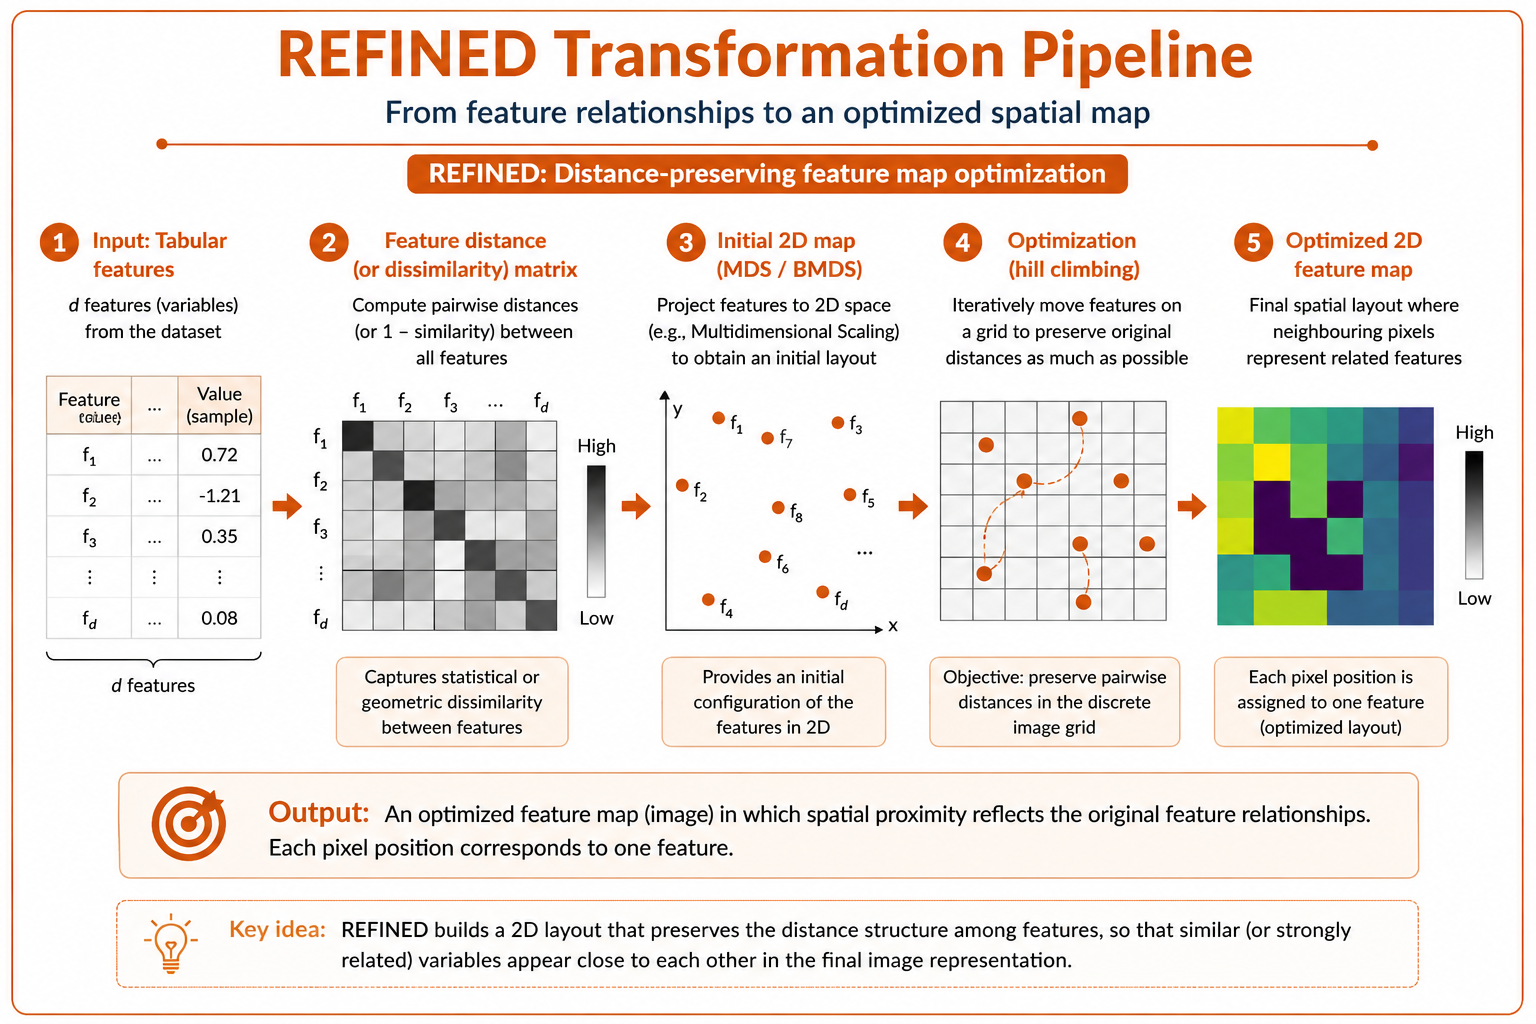 (Figure 4. REFINED transformation pipeline. Feature relationships are first represented through a distance or dissimilarity matrix. A two-dimensional map is then optimized so that neighbouring pixels encode variables with strong statistical or geometric relationships.)
Strengths and limitations
REFINED is particularly attractive when the preservation of distance relationships among features is important. It can be useful in domains where variables have complex dependency structures and where a carefully optimized spatial map may improve the behaviour of convolutional architectures.
Its main limitation is computational cost. For datasets with thousands of features, the optimization process can become expensive. In addition, the quality of the resulting representation depends on the distance metric, the optimization strategy and the resolution of the image grid.
3. IGTD: Image Generator for Tabular Data
IGTD (Image Generator for Tabular Data) follows a different strategy. Instead of relying mainly on dimensionality reduction or geometric projection, IGTD aims to preserve the ranking of feature relationships when assigning features to image pixels.
The central idea is that if two features are highly similar in the original tabular space, they should be placed close to each other in the image grid. Conversely, features that are less related should be placed farther apart.
How it works
The IGTD workflow can be summarized as follows:
- A feature-similarity or feature-distance matrix is computed from the tabular dataset.
- A target image grid is defined.
- Each feature is assigned to a unique pixel in the grid.
- The method iteratively swaps feature positions to reduce the discrepancy between:
- the ranking of feature distances in the original tabular space;
- the ranking of pixel distances in the image space.
- The final image representation is dense: each selected feature occupies one pixel.
This makes IGTD especially suitable when compact image representations are desired. Unlike methods that may create sparse images or require blurring, IGTD tends to generate dense grids where most pixels carry feature information.
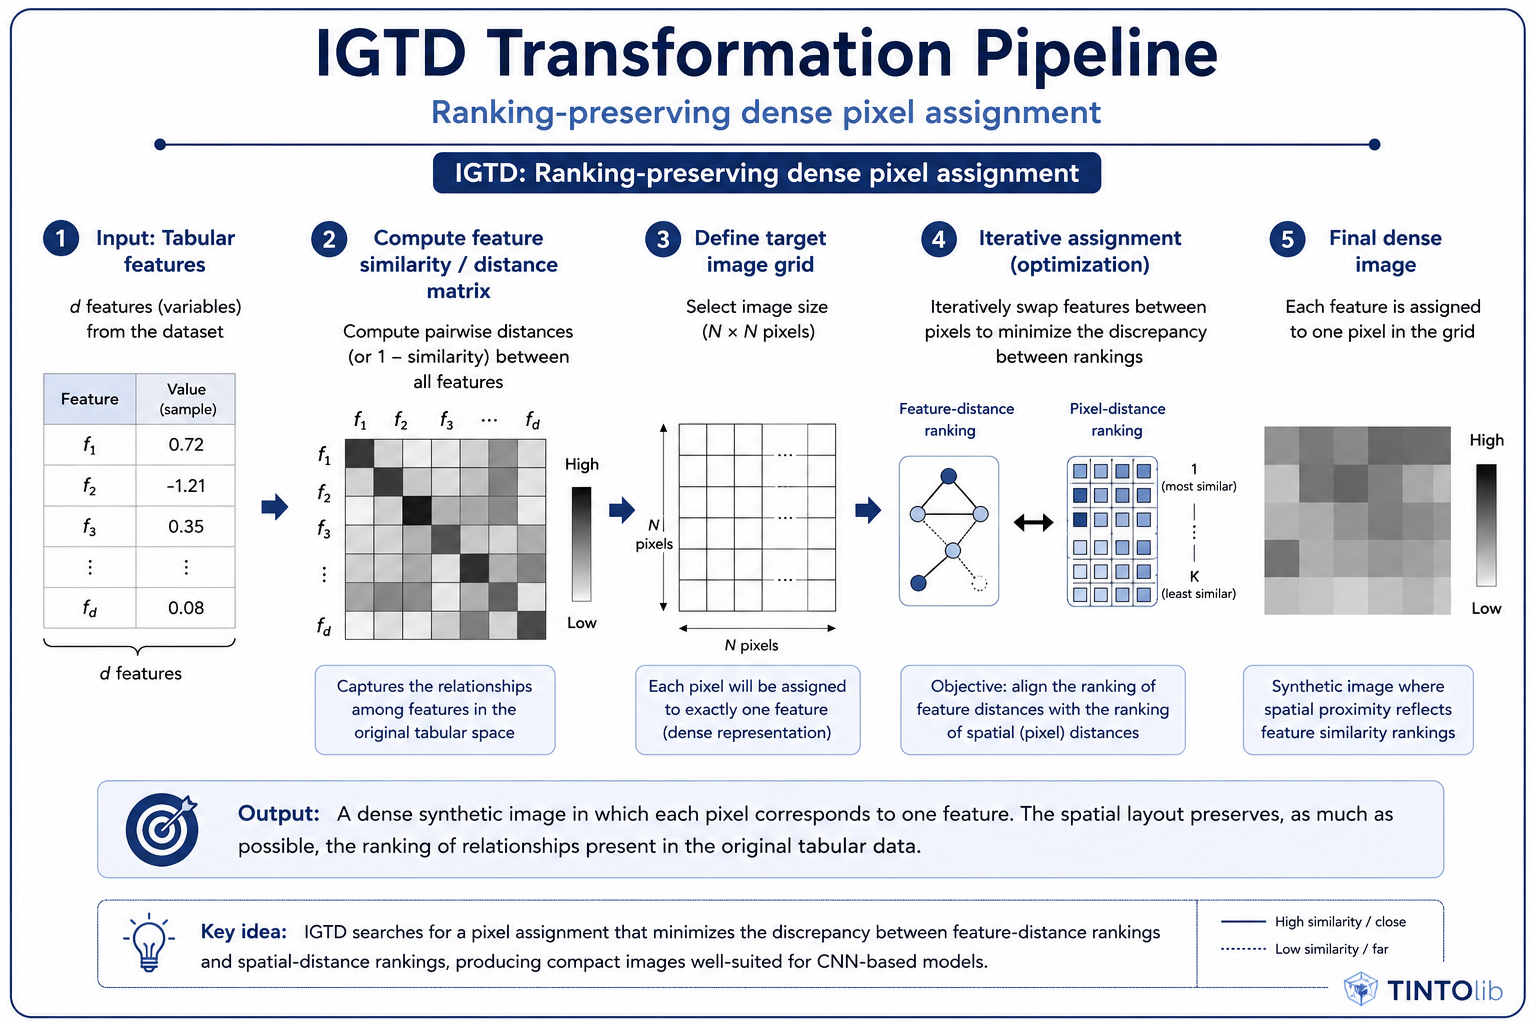 (Figure 5. IGTD transformation pipeline. The method searches for a dense assignment of features to pixels by minimizing the discrepancy between feature-distance rankings in the original tabular space and spatial-distance rankings in the generated image.)
Strengths and limitations
IGTD is useful when the objective is to create compact synthetic images with a direct relationship between features and pixels. This can reduce the input size required by CNNs and improve computational efficiency during neural training.
However, the optimization process can still be costly for high-dimensional datasets. In addition, the resulting images may be less visually intuitive than TINTO representations, especially when the grid is very dense or when feature relationships are complex.
Comparative pipeline overview
Although TINTO, REFINED and IGTD all transform tabular samples into images, their assumptions are different. TINTO emphasizes projection and optional smoothing. REFINED emphasizes distance-preserving spatial optimization. IGTD emphasizes dense pixel assignment based on ranking preservation.
Comparative summary
| Dimension | TINTO | REFINED | IGTD |
|---|---|---|---|
| Core idea | Dimensionality reduction + pixel mapping + optional blurring | Distance-preserving feature map optimization | Ranking-preserving dense pixel assignment |
| Mathematical basis | PCA / t-SNE and blurring | MDS / Bayesian MDS + hill climbing | Feature similarity ranking vs. pixel-distance ranking |
| Computational cost | Low to medium | Medium to high | Medium to high |
| Visual representation | Sparse or semi-sparse with blurring | Optimized spatial grid | Dense and compact grid |
| One feature per pixel | Not necessarily | Usually spatially assigned | Yes, dense assignment |
| Best suited for | Fast experimentation, visual intuition, hybrid models | High-dimensional scientific datasets where distance preservation matters | Compact representations and efficient CNN input |
| Main limitation | Sensitive to dimensionality-reduction choices | Higher optimization cost | Optimization can be expensive for many features |
| Data leakage risk | Must fit only on training data | Must fit only on training data | Must fit only on training data |
| Interpretability | High visual intuition due to blurring and spatial patterns | Strong geometric interpretation | Compact but sometimes less visually intuitive |
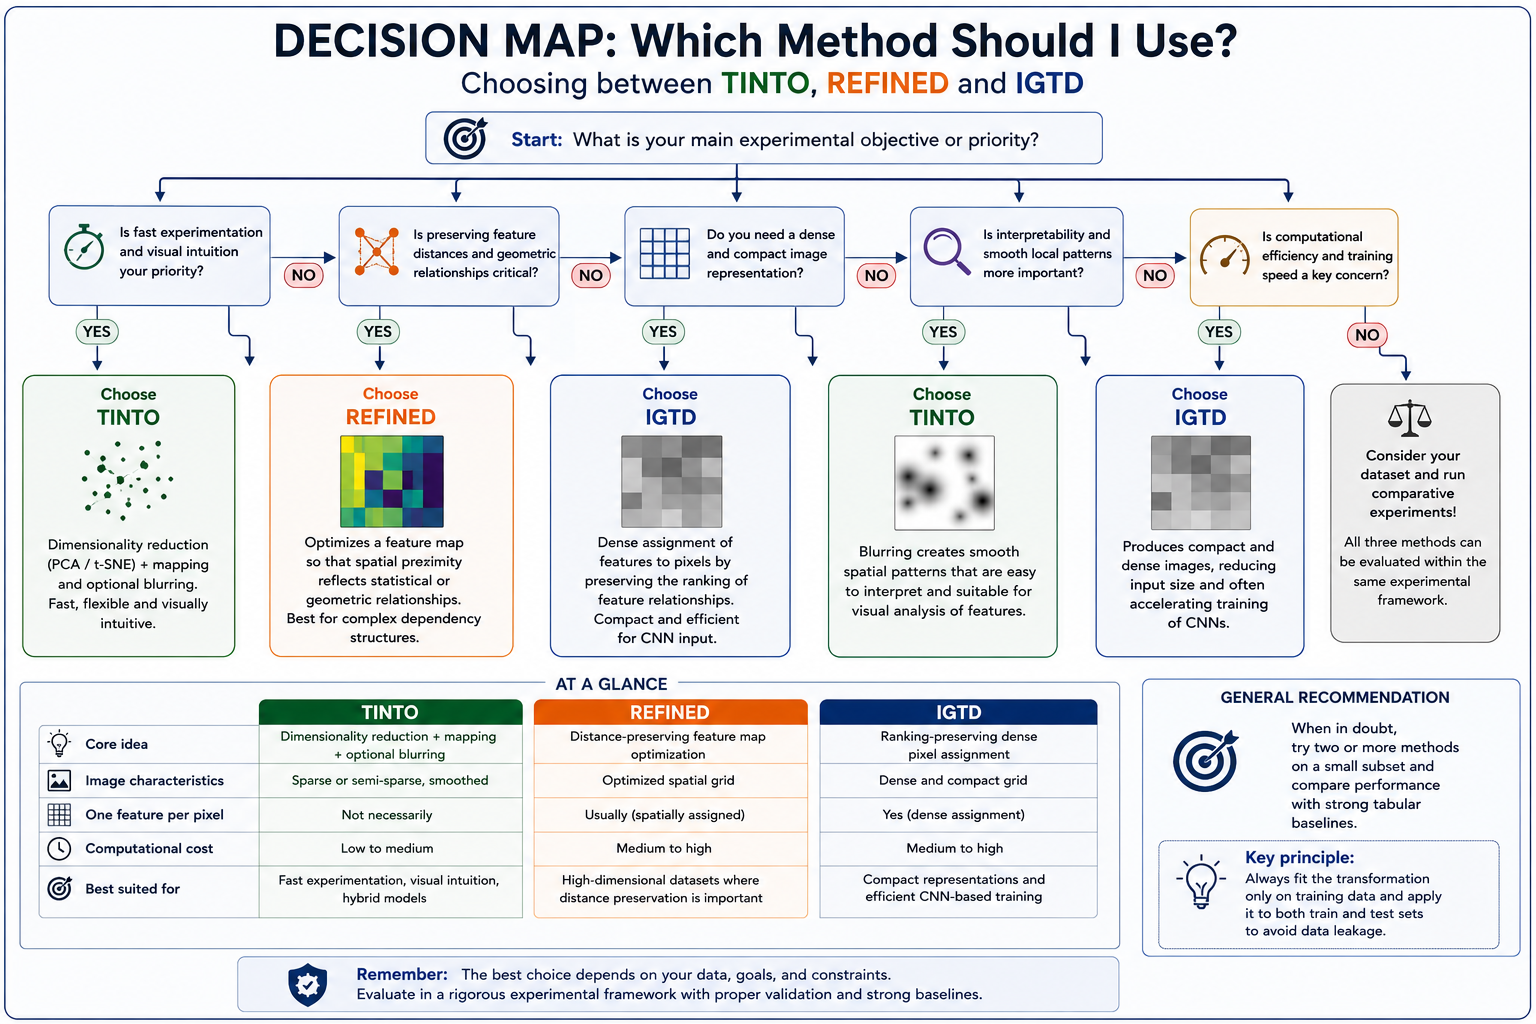 (Figure 6. Practical decision map for selecting among TINTO, REFINED and IGTD depending on the experimental objective. The choice depends on whether the priority is fast experimentation, distance-preserving spatial optimization, dense image construction, interpretability, or computational efficiency.)
Methodological note: avoid data leakage
A critical issue in tabular data into synthetic image transformation is data leakage.
If the spatial layout of the features is learned using the full dataset before splitting into training and test partitions, information from the test set may influence the generated image representation. This can lead to overly optimistic results and invalid generalization estimates.
For rigorous experimentation, the recommended workflow is:
- Split the original tabular dataset into training and test partitions.
- Fit the tabular data into synthetic images transformation only on the training data.
- Apply the learned transformation to both training and test data.
- Train the neural model using only the generated training images.
- Evaluate the final model on the generated test images.
This principle is especially important when comparing TINTO, REFINED and IGTD, because the comparison should reflect the generalization capacity of each representation, not hidden information transferred from the test set.
Practical implementation in Python with TINTOlib
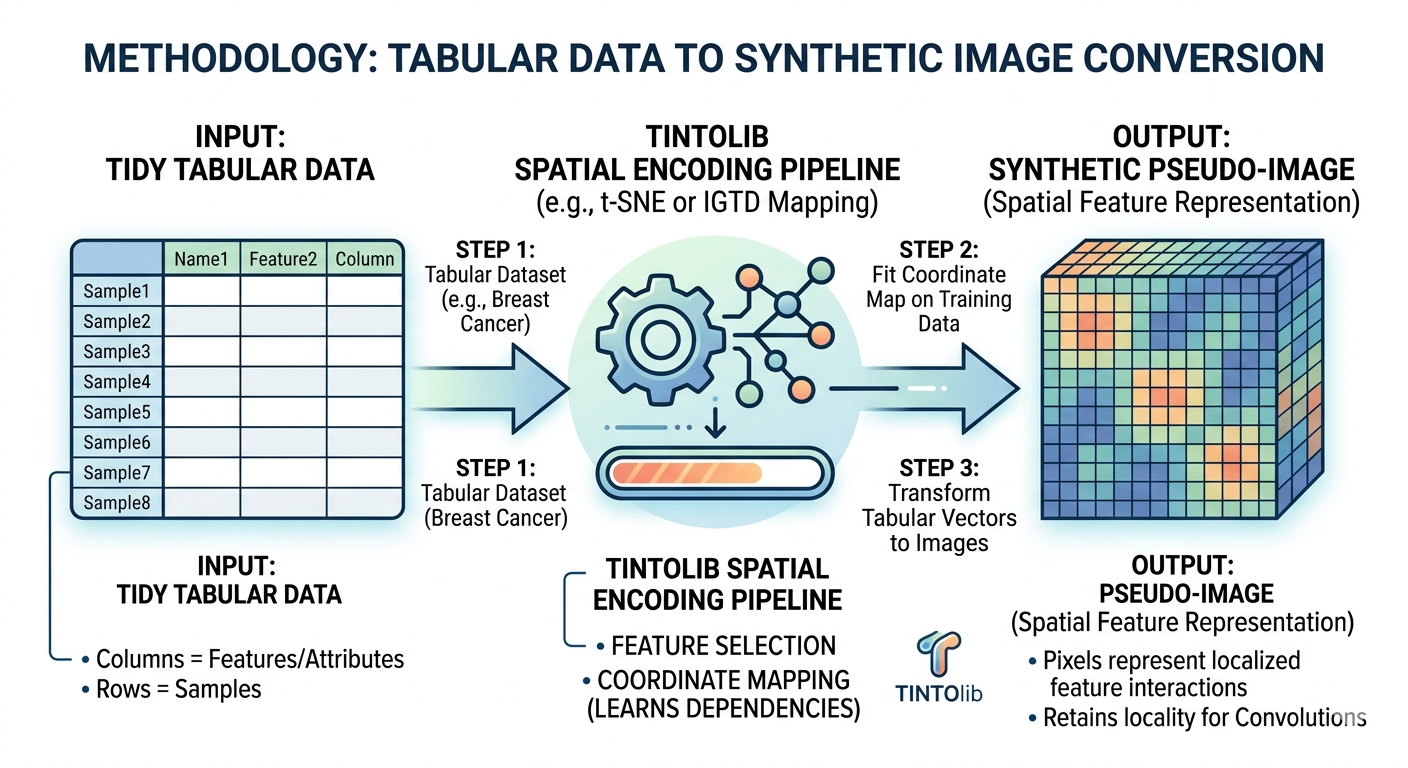
One of the main advantages of TINTOlib is that it provides a unified interface for different tabular data into synthetic image transformation methods. This makes it possible to compare TINTO, REFINED and IGTD within a common experimental workflow.
The following example uses the Breast Cancer Wisconsin dataset from Scikit-Learn. The key methodological point is that the train/test split is performed before fitting any transformation.
import os
import pandas as pd

from sklearn.datasets import load_breast_cancer
from sklearn.model_selection import train_test_split

from TINTOlib.tinto import TINTO
from TINTOlib.igtd import IGTD
from TINTOlib.refined import REFINED

# ---------------------------------------------------------
# 1. Load a reproducible tabular dataset
# ---------------------------------------------------------
raw_data = load_breast_cancer()

df = pd.DataFrame(raw_data.data, columns=raw_data.feature_names)
df["target"] = raw_data.target

# ---------------------------------------------------------
# 2. Split before fitting any tabular data into synthetic images transformation
# ---------------------------------------------------------
train_df, test_df = train_test_split(
    df,
    test_size=0.2,
    random_state=42,
    stratify=df["target"]
)

# ---------------------------------------------------------
# 3. Create output folders
# ---------------------------------------------------------
output_dirs = {
    "TINTO": {
        "train": "synthetic_images/tinto/train",
        "test": "synthetic_images/tinto/test"
    },
    "IGTD": {
        "train": "synthetic_images/igtd/train",
        "test": "synthetic_images/igtd/test"
    },
    "REFINED": {
        "train": "synthetic_images/refined/train",
        "test": "synthetic_images/refined/test"
    }
}

for method_dirs in output_dirs.values():
    os.makedirs(method_dirs["train"], exist_ok=True)
    os.makedirs(method_dirs["test"], exist_ok=True)

# ---------------------------------------------------------
# 4. Define the transformation methods
# ---------------------------------------------------------
methods = {
    "TINTO": TINTO(
        problem="supervised",
        algorithm="t-SNE",
        pixels=30,
        blur=True
    ),
    "IGTD": IGTD(
        problem="supervised"
    ),
    "REFINED": REFINED(
        problem="supervised"
    )
}

# ---------------------------------------------------------
# 5. Fit each method only on the training partition
#    and then transform both train and test partitions
# ---------------------------------------------------------
for method_name, model in methods.items():
    print(f"Generating synthetic images with {method_name}...")

    model.fit(train_df)

    model.transform(
        train_df,
        output_dirs[method_name]["train"]
    )

    model.transform(
        test_df,
        output_dirs[method_name]["test"]
    )

print("Synthetic image generation completed successfully.")
The generated image folders can then be used with standard PyTorch or TensorFlow pipelines, for example through torchvision.datasets.ImageFolder or custom dataset loaders.
After executing the transformation pipeline, each method generates a different synthetic image representation from the original tabular samples. Although the input data are the same, the resulting images are not visually equivalent, because each method follows a different criterion to organize the features in the image space.
- IGTD produces compact grid-like representations where the feature-to-pixel assignment is guided by the preservation of distance relationships.
- REFINED generates spatial layouts where the arrangement of features is optimized according to pairwise relationships among variables.
- TINTO creates structured synthetic images with an explicit visual encoding, where dimensionality reduction and optional blurring help introduce spatial continuity.
The following figure illustrates these differences by showing representative synthetic images generated with the three methods. The goal is not to decide which image is visually more appealing, but to highlight that each method creates a different spatial topology. These topologies may affect how CNNs, Vision Transformers or hybrid neural networks learn from the transformed tabular data.
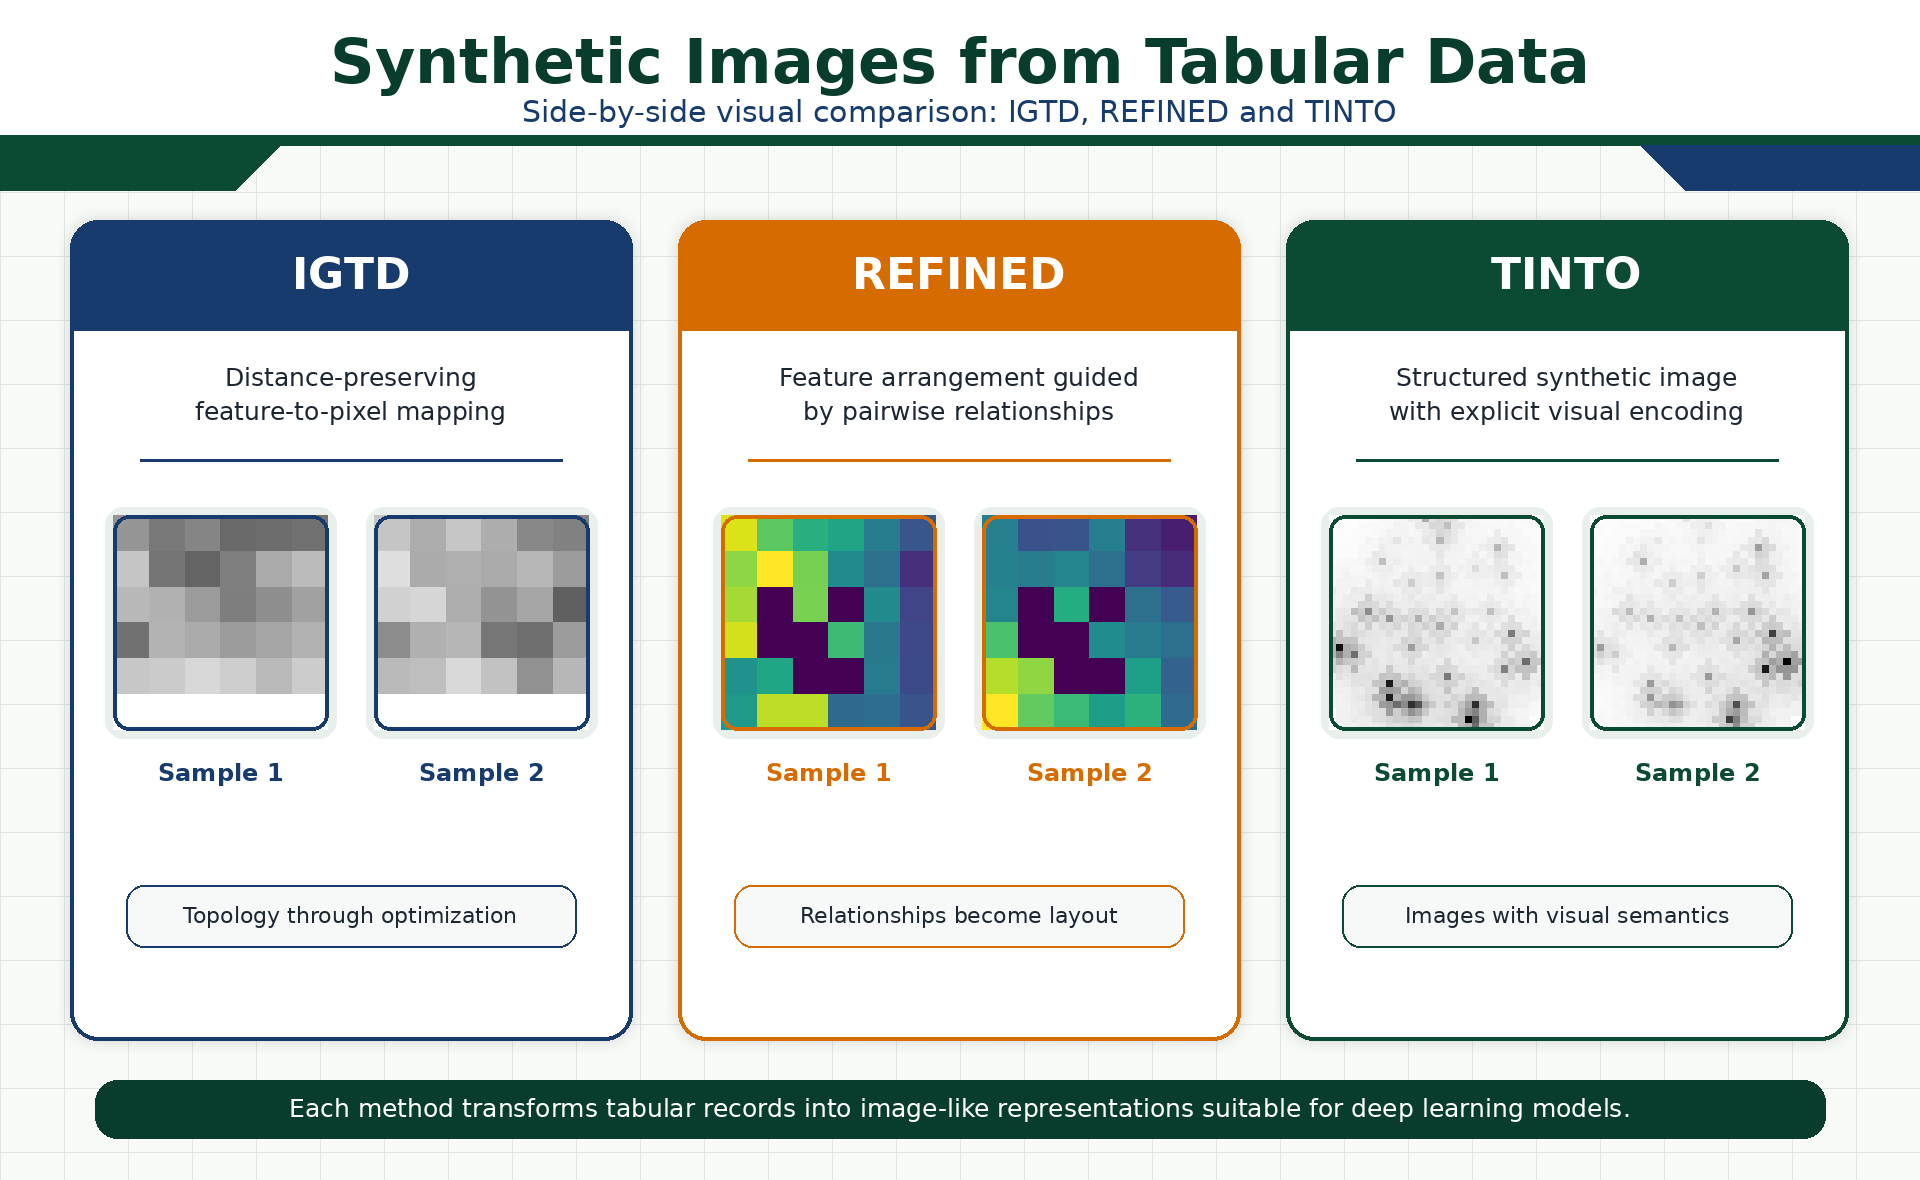 (Figure 7. Visual comparison of synthetic images generated with IGTD, REFINED and TINTO. Each method transforms the same type of tabular data into a different image topology, reflecting its own spatial encoding criterion and potentially influencing how vision-based neural models learn from the generated representations.)
Practical interpretation
From a practical point of view, the three methods should be seen as complementary rather than mutually exclusive:
- Use TINTO when the objective is fast experimentation, visual interpretability and flexible synthetic image generation.
- Use REFINED when the dataset contains complex feature relationships and the preservation of geometric distances is central to the experiment.
- Use IGTD when dense and compact image representations are needed, especially for efficient CNN-based training.
In all cases, the generated images should be evaluated against strong tabular baselines such as Random Forest, XGBoost, LightGBM or CatBoost. Synthetic images are not automatically superior to classical models; their value depends on whether the spatial representation helps the neural architecture exploit meaningful feature interactions.
Conclusion
TINTO, REFINED and IGTD represent three different ways of addressing the same fundamental question: how can we construct a meaningful spatial representation from tabular data?
TINTO provides a flexible and visually intuitive transformation based on dimensionality reduction and optional blurring. REFINED focuses on preserving feature relationships through geometric optimization. IGTD generates dense image layouts by aligning feature-similarity rankings with pixel-distance rankings.
The key point is that these methods should not be evaluated only by the visual appearance of the generated images. They must be assessed through rigorous experimental protocols, strong tabular baselines, leakage-free validation, and downstream performance using CNNs, Vision Transformers or hybrid neural architectures.
TINTOlib makes this comparison practical by providing a unified framework where different tabular data into synthetic image methods can be tested under comparable conditions. This is essential for understanding when synthetic images are genuinely useful, when they provide interpretable spatial structure, and when classical tabular models may still remain the strongest baseline.
References and related publications
The concepts discussed in this tutorial are connected to the following research and software publications on TINTO, TINTOlib, tabular data into synthetic images transformation, synthetic spatial representations, hybrid neural networks and indoor localisation.
Research articles
Jiayun Liu, Manuel Castillo-Cara et al. Interpretable Hybrid Vision Transformer Architectures for MIMO-Based Indoor Localization using Synthetic Spatial Representations. IEEE Internet of Things. DOI: 10.1109/JIOT.2026.3696106
Jiayun Liu, Manuel Castillo-Cara et al. A Comprehensive Benchmark of Spatial Encoding Methods for Tabular Data with Deep Neural Networks. Information Fusion. DOI: 10.1016/j.inffus.2025.104088
Manuel Castillo-Cara et al. MIMO-Based Indoor Localisation with Hybrid Neural Networks. IEEE Journal of Selected Topics in Signal Processing. DOI: 10.1109/JSTSP.2025.3555067
Reewos Talla-Chumpitaz, Manuel Castillo-Cara et al. Blurring Image Techniques for Bluetooth-based Indoor Localisation. Information Fusion. DOI: 10.1016/j.inffus.2022.10.011
Software articles
Jiayun Liu et al. TINTOlib: A Python library for transforming tabular data into synthetic images for deep neural networks. SoftwareX. DOI: 10.1016/j.softx.2025.102444
Manuel Castillo-Cara et al. TINTO: Converting Tidy Data into Image for Classification with 2-Dimensional Convolutional Neural Networks. SoftwareX. DOI: 10.1016/j.softx.2023.101391
Continue learning Artificial Intelligence
Explore practical courses on AI, Machine Learning, Deep Learning, Python, R and applied data science.

© Manuel Castillo-Cara, PhD. Content licensed under CC BY-NC 4.0 unless otherwise stated.