TINTOlib · Clusters · RGB Fusion · Structural Stability
RGB Fusion and Structural Stability
How mixMethod combines complementary unsupervised representations across RGB channels and how TINTOlib uses SSIM to select stable representation dimensions.
Tutorial metadata
- Author: Manuel Castillo-Cara, PhD
- Affiliation: Dpt. of Artificial Intelligence, Universidad Nacional de Educación a Distancia (UNED), Spain
- Role: Researcher, Professor, and TINTOlib Python Library Developer
- License: CC BY-NC 4.0 unless otherwise stated.
Series note — Part IV of IV. This article closes the four-part technical series on the unsupervised representations available through the TINTOlib
Clustersclass.
- Part I — From Clusters to Pixels: Unsupervised Synthetic Image Generation in TINTOlib
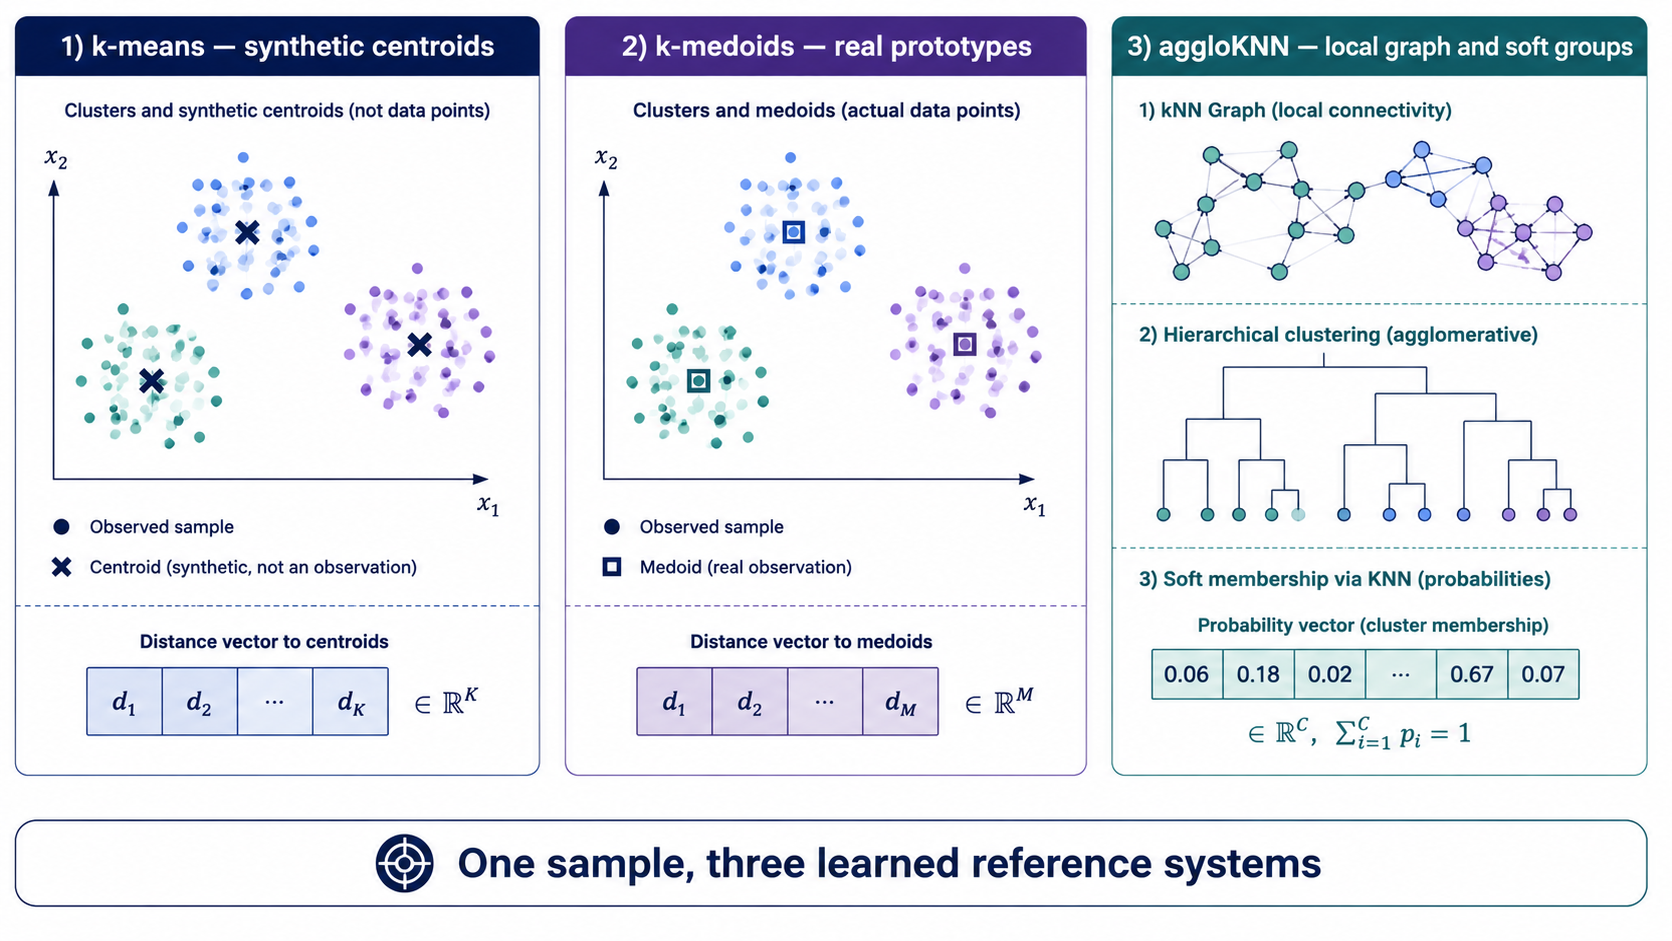
- Part II — Distance-Based Encodings in TINTOlib: k-Means, k-Medoids and aggloKNN
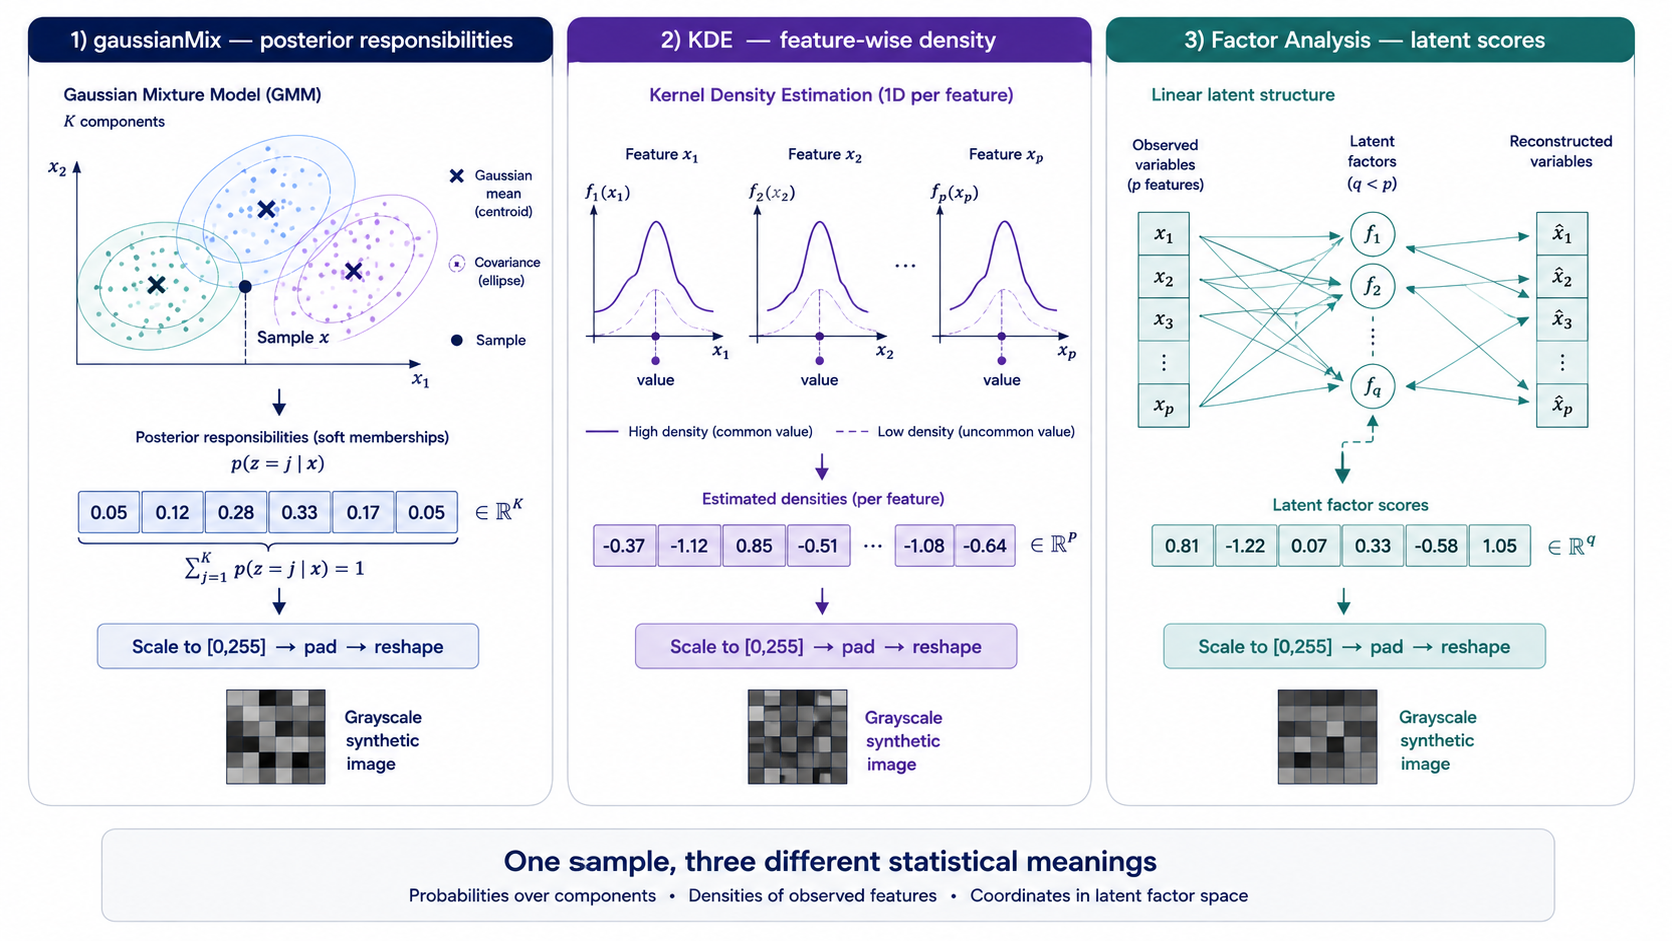
- Part III — Probabilities, Densities and Latent Factors in TINTOlib: gaussianMix, KDE and Factor Analysis
- Part IV — RGB Fusion and Structural Stability in TINTOlib:
mixMethod, channel composition and SSIM-based automatic selection — this article.
Video overview
The following short video summarizes the main concepts introduced in this final article.
From one representation to several complementary views
The first three articles in this series examined how a tabular sample can be converted into an image through different unsupervised intermediate representations:
- distances to synthetic centroids;
- distances to representative medoids;
- local KNN membership probabilities;
- Gaussian-mixture posterior responsibilities;
- feature-wise density estimates;
- latent Factor Analysis scores.
Each representation answers a different question about the same observation. A centroid-distance vector describes proximity to learned regions. A Gaussian-mixture vector describes soft component membership. A factor-score vector describes position in a latent covariance structure.
mixMethod introduces a different idea: instead of choosing only one description, it places several compatible representations into different colour channels of the same synthetic image.
Conceptually, for a tabular sample
\[\mathbf{x}_i \in \mathbb{R}^{p},\]three selected transformations may produce
\[\mathbf{r}_i^{(R)},\quad \mathbf{r}_i^{(G)},\quad \mathbf{r}_i^{(B)} \in \mathbb{R}^{k}.\]After training-based scaling, padding and square reshaping, they become
\[\mathbf{I}_i^{(R)}, \mathbf{I}_i^{(G)}, \mathbf{I}_i^{(B)} \in \{0,\ldots,255\}^{d\times d},\]where
\[d=\left\lceil \sqrt{k} \right\rceil.\]The final RGB representation is the channel-wise stack
\[\mathbf{I}_i^{(\mathrm{RGB})} = \operatorname{stack} \left( \mathbf{I}_i^{(R)}, \mathbf{I}_i^{(G)}, \mathbf{I}_i^{(B)} \right).\]The key point is that colour is not decorative. It is the visible consequence of combining different statistical descriptions of the same tabular record.
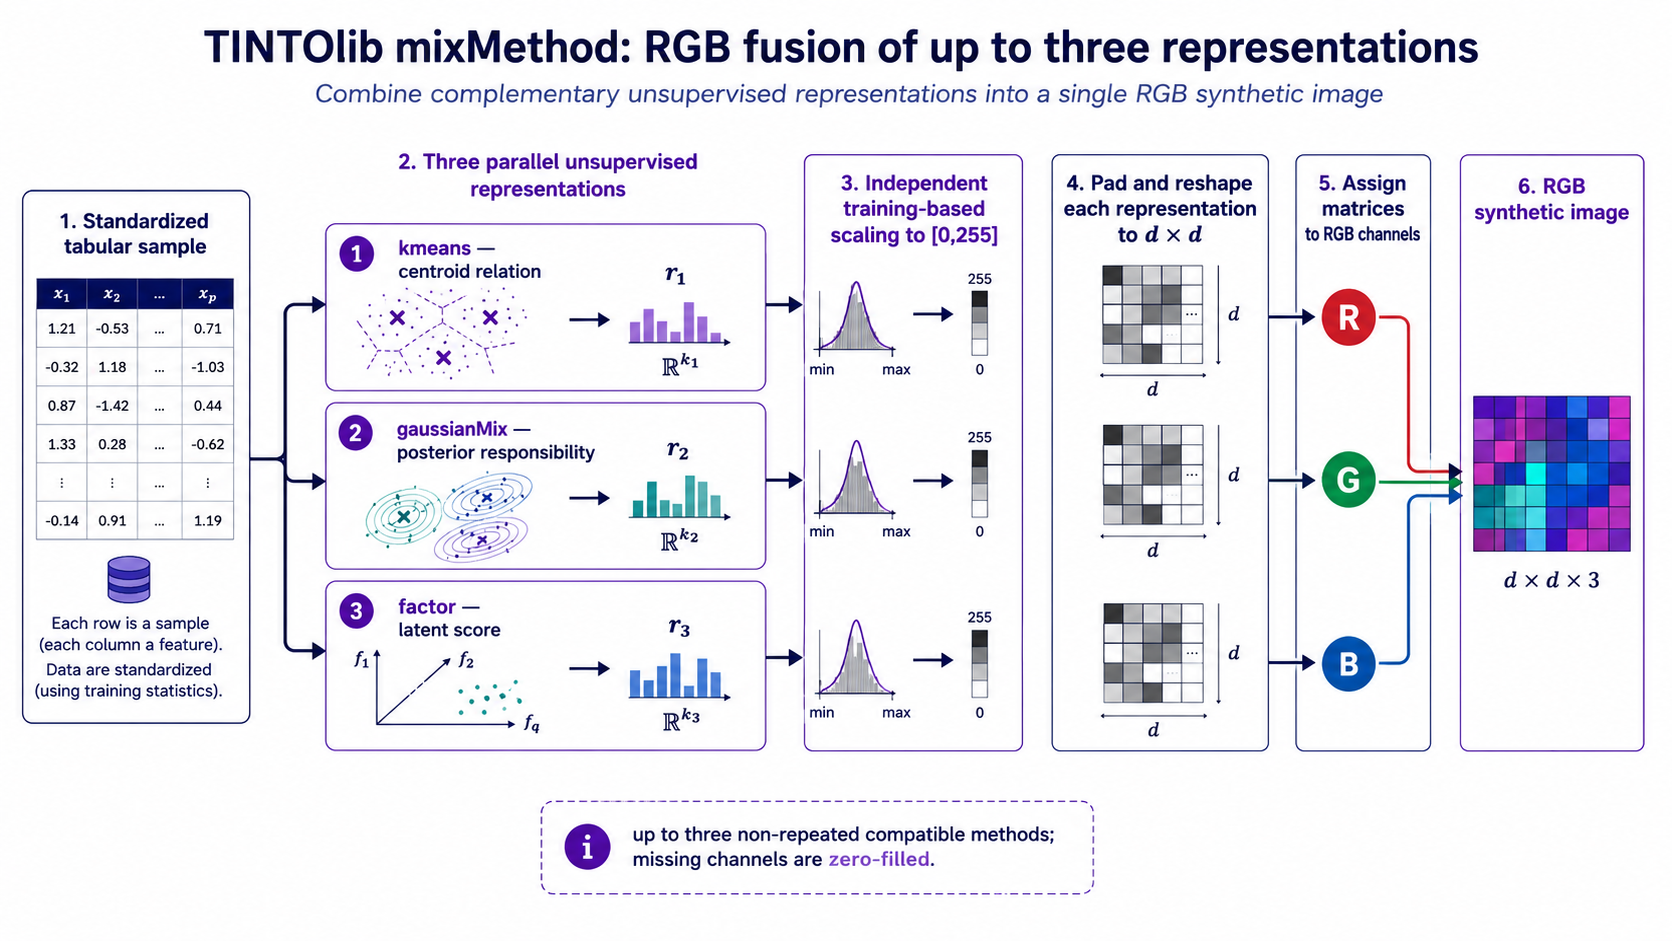
 (Figure 1. Conceptual workflow of
 mixMethod. The same standardized tabular sample is transformed by up to three compatible unsupervised methods. Each intermediate representation is independently scaled to pixel intensities, padded and reshaped, and the resulting matrices are assigned to the red, green and blue channels of one RGB synthetic image.)
1. mixMethod: multi-view synthetic images
The ensamMethod parameter determines which representations form the RGB image and, importantly, their order.
For example,
ensamMethod=["kmeans", "gaussianMix", "factor"]
means:
- R channel: k-means representation;
- G channel: Gaussian-mixture representation;
- B channel: Factor Analysis representation.
If fewer than three methods are supplied, TINTOlib fills the remaining higher channels with zero-valued matrices. Therefore,
ensamMethod=["kmeans", "factor"]
produces:
- R: k-means;
- G: factor;
- B: zeros.
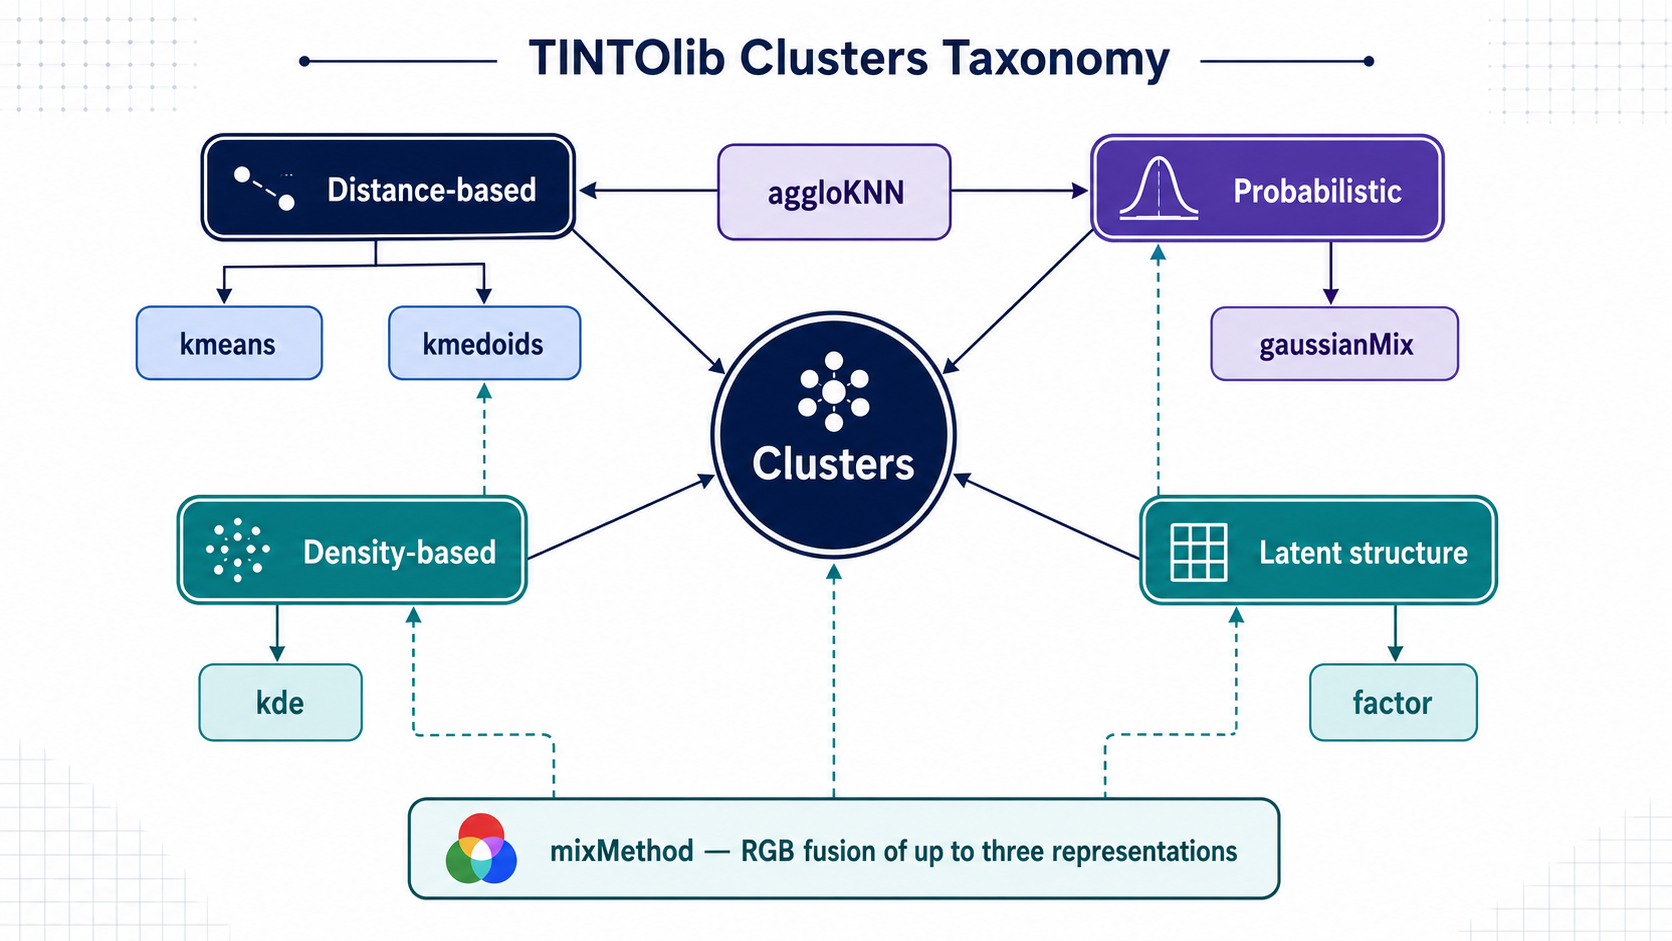
Which algorithms can be combined?
The current mixMethod implementation accepts the following component methods:
| Method | Available in mixMethod? | Channel semantics before pixel scaling |
|---|---|---|
kmeans | ✓ | Distances to centroids, or RBF similarities when enabled |
kmedoids | ✓ | Distances to representative medoids |
aggloKNN | ✓ | KNN membership probabilities derived from hierarchical pseudo-labels |
gaussianMix | ✓ | Posterior Gaussian-component responsibilities |
factor | ✓ | Latent factor scores |
kde | ✗ | Per-feature density vector has dataset-dependent dimensionality |
ensamMethod must be a non-empty list containing at most three non-repeated methods. KDE is excluded because its representation dimension is tied to the number of original features rather than to the shared n_clusters value used to align compatible channels.
When factor is included, the number of latent factors must also respect the dimensionality constraints imposed by Factor Analysis.
Channel alignment matters
An important implementation detail appears when k-means or k-medoids are used as individual grayscale methods. In that case, TINTOlib can reorder the learned references according to proximity before reshaping the representation.
Inside mixMethod, this reordering is intentionally not applied. Independently reorganizing one channel would break the positional correspondence with the other channels. The RGB representation therefore prioritizes channel alignment over the grayscale reference-ordering heuristic.
This distinction is important when interpreting the resulting image: a position $(u,v)$ should be understood as a shared channel index, not as three independently optimized spatial layouts.
Actual channels versus the final RGB image
A useful way to understand mixMethod is to inspect the component channels separately before looking at the colour image.
For a configuration such as
ensamMethod=["kmeans", "gaussianMix", "factor"]
the three channel matrices represent different numerical objects. Their final intensities are comparable as image values only after each method-specific MinMaxScaler has been fitted on the corresponding training representation.
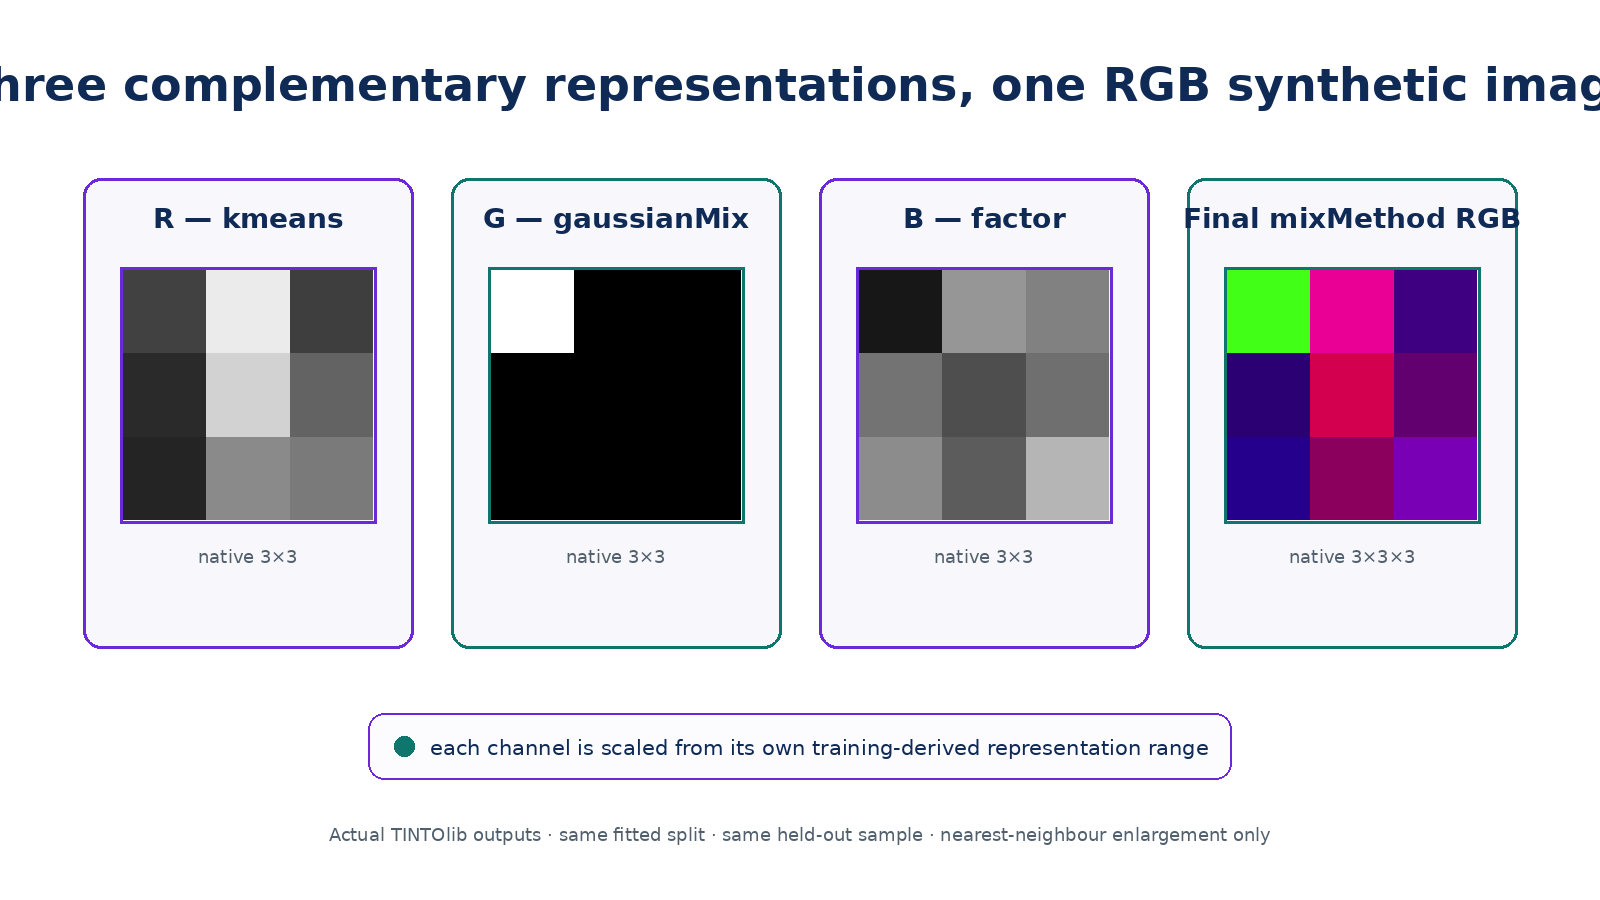 (Figure 2. Actual TINTOlib outputs for one tabular sample. The red, green and blue source matrices correspond to the methods specified in
 ensamMethod, while the final panel shows their RGB fusion. The component values are scaled independently from training-derived ranges before channel stacking; the final colour therefore reflects multi-view interaction rather than a single physical quantity.)
2. Interpreting colour without over-interpreting it
RGB fusion creates a visually richer image, but the colour itself must be interpreted carefully.
Consider a pixel at location $(u,v)$:
\[\mathbf{p}_{uv} = \left[ R_{uv}, G_{uv}, B_{uv} \right].\]If the channels correspond to kmeans, gaussianMix and factor, the three values do not measure the same quantity:
- $R_{uv}$ may represent a centroid distance or RBF similarity;
- $G_{uv}$ may represent a posterior component responsibility;
- $B_{uv}$ may represent a latent-factor score after training-based scaling.
Consequently, a purple, cyan or yellow region should not be interpreted as a predefined semantic class. It emerges from the numerical interaction of the selected channel values.
Channel order is part of the experimental configuration
Because ensamMethod determines the channel assignment, changing the order changes the visible colours even when the same three component representations are used.
For example,
["kmeans", "gaussianMix", "factor"]
and
["factor", "kmeans", "gaussianMix"]
contain the same three representational families but assign them to different colour axes.
This does not automatically mean that the underlying information has changed. It means that the RGB encoding has changed. For reproducible experiments, the exact order of ensamMethod should therefore be reported together with the remaining hyperparameters.
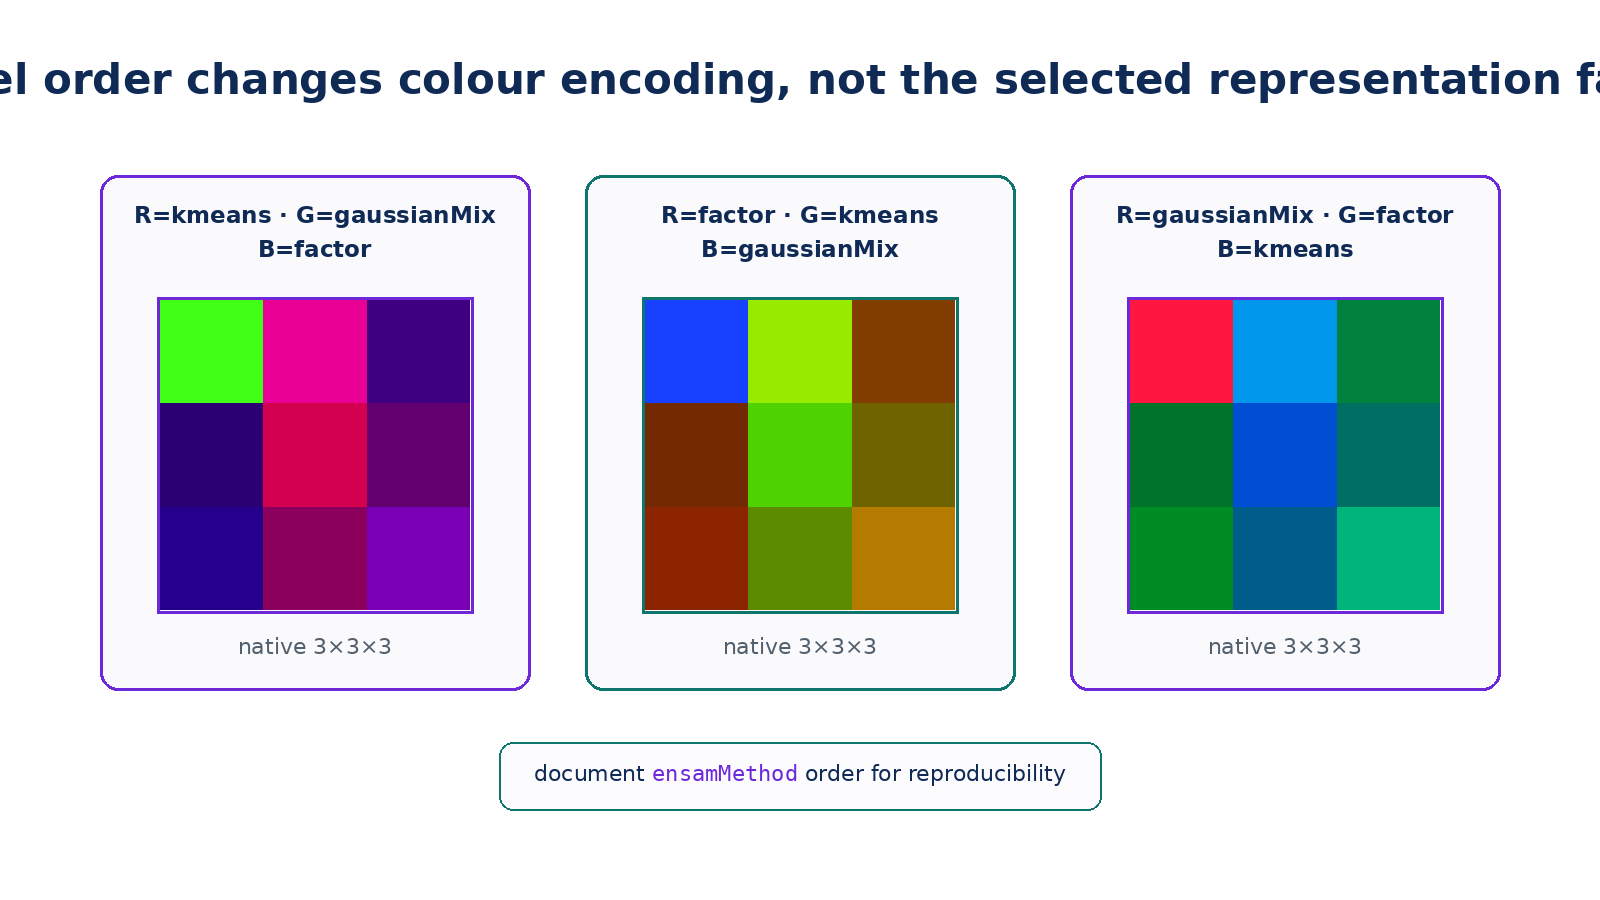 (Figure 3. Channel interpretation in
 mixMethod. The order of ensamMethod determines which representation occupies R, G and B. Swapping channel assignments changes the visible colour composition even when the same underlying component representations are used. Channel order should therefore be treated as part of the documented experimental configuration.)
Practical implementation: a leakage-free RGB pipeline
The following example uses the Wine dataset and combines three complementary views:
- k-means with Gaussian RBF similarity;
- Gaussian-mixture responsibilities;
- Factor Analysis scores.
Nine components are used so that every channel forms a native $3\times3$ matrix without padding.
from pathlib import Path

import pandas as pd
from sklearn.datasets import load_wine
from sklearn.model_selection import train_test_split

from TINTOlib.clusters import Clusters

# ---------------------------------------------------------
# 1. Load a reproducible tabular dataset
# ---------------------------------------------------------
raw_data = load_wine()

df = pd.DataFrame(
    raw_data.data,
    columns=raw_data.feature_names
)

# The target column must be the final column.
df["target"] = raw_data.target

# ---------------------------------------------------------
# 2. Split BEFORE fitting the transformation
# ---------------------------------------------------------
train_df, test_df = train_test_split(
    df,
    test_size=0.20,
    random_state=42,
    stratify=df["target"]
)

# ---------------------------------------------------------
# 3. Configure a three-view RGB representation
# ---------------------------------------------------------
model = Clusters(
    problem="classification",
    algorithm="mixMethod",
    n_clusters=9,
    ensamMethod=[
        "kmeans",
        "gaussianMix",
        "factor"
    ],
    random_seed=1,
    n_init=5,
    max_iter=300,
    algorithmMethod="lloyd",
    RBFKmeans=True,
    covariance_type="full"
)

# ---------------------------------------------------------
# 4. Fit ONLY on training data
# ---------------------------------------------------------
model.fit(train_df)

# ---------------------------------------------------------
# 5. Reuse the fitted transformation
# ---------------------------------------------------------
train_output = Path("synthetic_images/mixMethod/train")
test_output = Path("synthetic_images/mixMethod/test")

model.transform(
    train_df,
    str(train_output)
)

model.transform(
    test_df,
    str(test_output)
)

print("RGB synthetic images generated successfully.")
This workflow is leakage-free because the StandardScaler, the unsupervised component models and the channel-specific image scalers are learned from the training partition and reused for the test data.
Parameter compatibility in mixMethod
The admissible constructor parameters depend on the methods included in ensamMethod.
| Component included | Relevant parameters |
|---|---|
kmeans | n_clusters, random_seed, n_init, max_iter, algorithmMethod, RBFKmeans |
gaussianMix | n_clusters, random_seed, n_init, max_iter, covariance_type |
aggloKNN | n_clusters, metric |
kmedoids | n_clusters, metric, random_seed, max_iter |
factor | n_clusters, random_seed |
When aggloKNN or kmedoids is used inside mixMethod, the current shared metric validation for the combined method accepts euclidean or manhattan.
This illustrates a general design principle: mixMethod is not a free concatenation of arbitrary methods. The representations must remain dimensionally compatible and share a coherent image geometry.
3. Why automatically select n_clusters?
For most component-based methods, n_clusters controls more than the internal clustering model. It also controls the dimensionality of the representation and, indirectly, the image resolution.
For a representation with $k$ components,
\[d = \left\lceil \sqrt{k} \right\rceil.\]Therefore:
n_clusters | Native image side |
|---|---|
| 9 | $3\times3$ |
| 16 | $4\times4$ |
| 25 | $5\times5$ |
| 36 | $6\times6$ |
| 49 | $7\times7$ |
| 64 | $8\times8$ |
| 81 | $9\times9$ |
Choosing $k$ therefore changes both the learned representation and the visual structure presented to the downstream neural network.
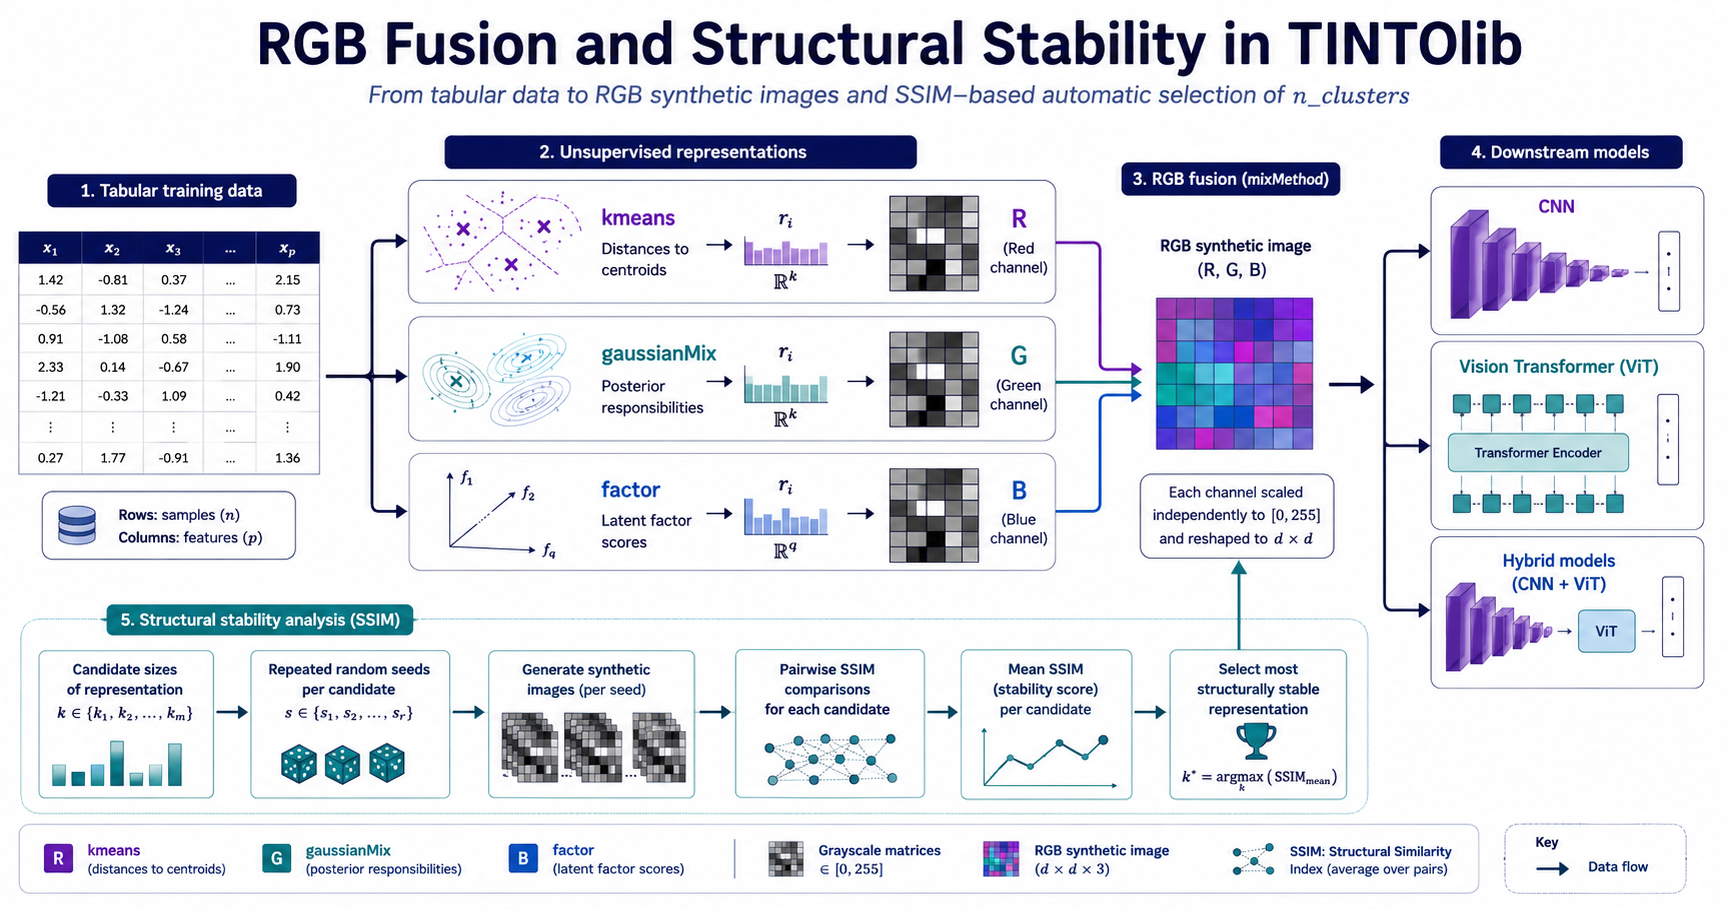
TINTOlib provides an automatic selection mechanism based on structural stability rather than only on an internal clustering objective.
4. SSIM as a structural-stability criterion
The Structural Similarity Index Measure (SSIM) compares two images by considering their luminance, contrast and structural organization.
Its interpretation in this context is straightforward:
- SSIM close to 1: the generated images remain structurally similar;
- SSIM close to 0: the image structures differ substantially;
- negative values: very strong structural disagreement may occur.
TINTOlib uses SSIM to ask a specific question:
If the unsupervised model is initialized differently, does a given representation size still produce structurally similar synthetic images?
This is different from asking whether a particular $k$ minimizes inertia, maximizes likelihood or achieves the best downstream predictive metric.
Current automatic-selection procedure
For a compatible algorithm, n_clusters can be:
n_clusters=25
a predefined list:
n_clusters=[9, 16, 25, 36, 49]
or:
n_clusters="auto"
When "auto" is used, the current candidate set is:
[9, 16, 25, 36, 49, 64, 81]
The procedure implemented in TINTOlib can be summarized as follows:
- Define the candidate values of $k$.
- For every candidate, fit the transformation under several random seeds.
- Convert every run into synthetic images.
- For every sample, compare all unique pairs of images obtained across seeds using SSIM.
- Average the pairwise similarities to obtain a per-sample stability score.
- Average across the evaluated samples.
- Select the $k$ with the highest mean structural stability.
The current implementation calls this procedure with six random seeds during automatic fitting.
For computational reasons, the stability analysis uses at most the first:
- 10,000 training instances for individual compatible methods;
- 2,000 training instances for
mixMethod.
When factor participates, candidate values are restricted by the maximum admissible latent dimensionality.
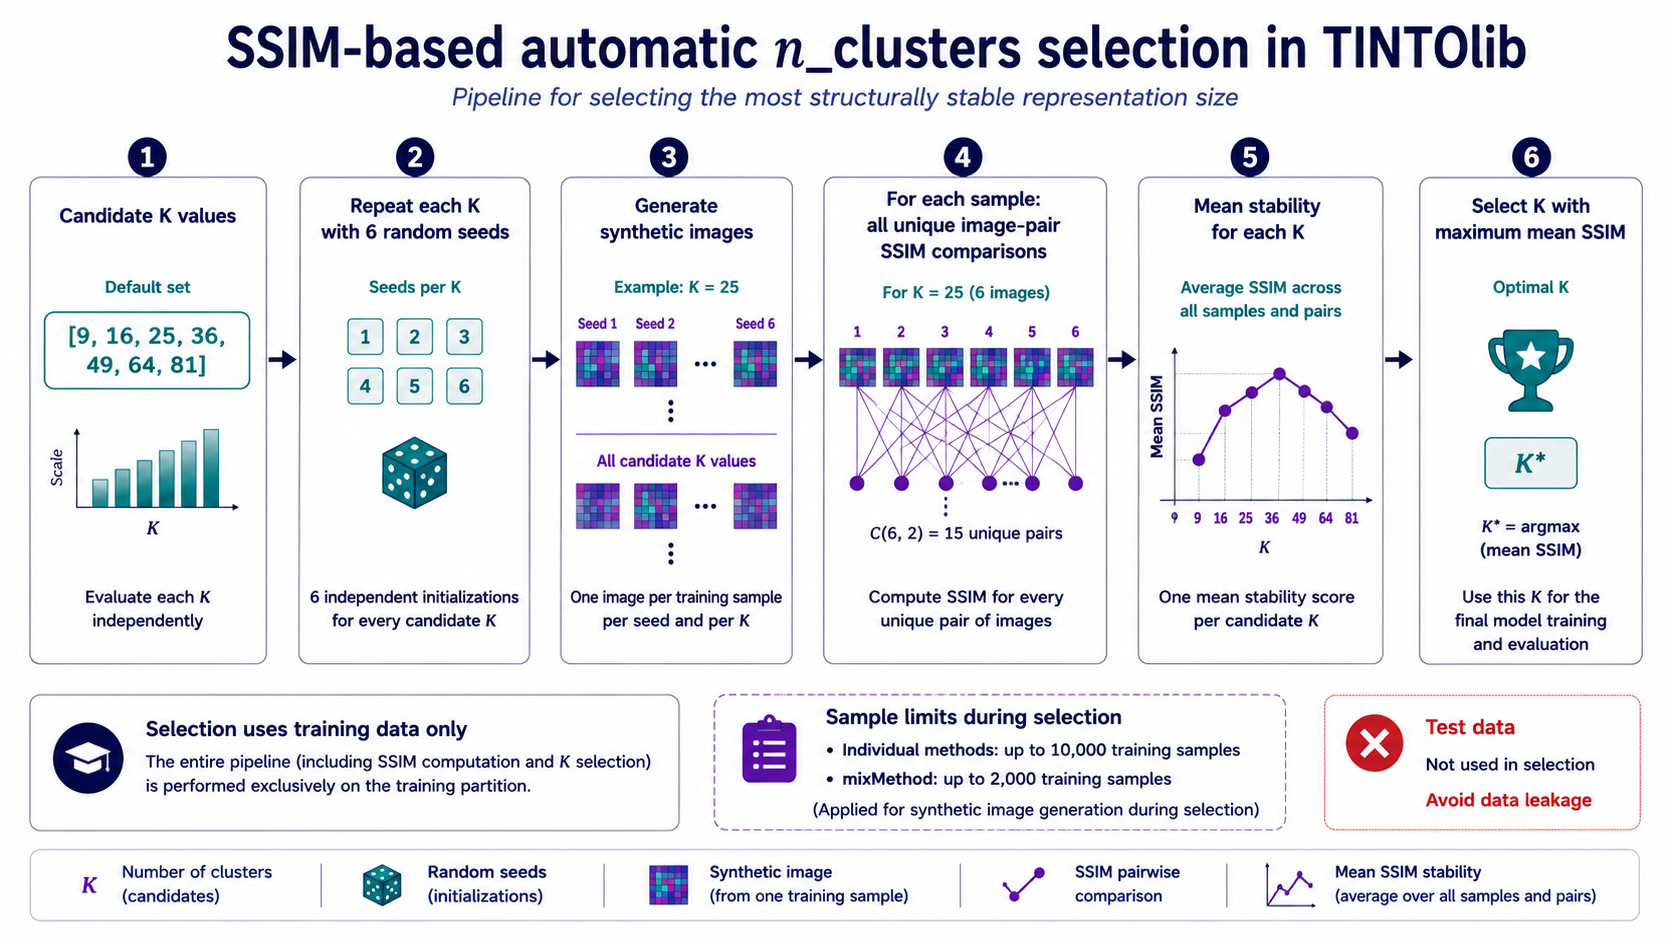 (Figure 4. SSIM-based selection of the representation dimension. For every candidate value of
 n_clusters, TINTOlib generates images under several random initializations, computes pairwise structural similarities for each sample, averages the stability scores and selects the candidate with the highest mean SSIM.)
Methods for which automatic selection is available
The current implementation enables SSIM-based automatic selection for:
kmeans;kmedoids;gaussianMix;factor;mixMethod.
There are two important exceptions.
KDE
kde does not use n_clusters. Its representation dimension is determined directly by the number of original features. Therefore, there is no equivalent cluster-number hyperparameter to optimize through this procedure.
aggloKNN
When used individually, aggloKNN does not support automatic n_clusters selection in the current implementation. Its hierarchical/KNN procedure is not driven by the same random initialization mechanism required by this stability experiment.
However, aggloKNN can participate inside mixMethod. In that case, the shared representation dimension is determined by the combined configuration, allowing channel compatibility to be maintained.
Practical automatic selection
For a single k-means representation:
model = Clusters(
    problem="classification",
    algorithm="kmeans",
    n_clusters=[9, 16, 25, 36, 49],
    random_seed=1,
    n_init=5,
    max_iter=300,
    RBFKmeans=True
)

model.fit(train_df)

print(
    "Selected n_clusters:",
    model.n_clusters
)
The same interface can be used with "auto":
model = Clusters(
    problem="classification",
    algorithm="kmeans",
    n_clusters="auto",
    random_seed=1,
    n_init=5,
    max_iter=300,
    RBFKmeans=True
)

model.fit(train_df)
Automatic selection for an RGB representation
With Wine, including factor strongly constrains the admissible values because the number of latent factors is bounded by the number of input variables. To illustrate a wider SSIM candidate grid, the following example combines methods whose representation dimensionality can share the same candidate values:
model_rgb_auto = Clusters(
    problem="classification",
    algorithm="mixMethod",
    n_clusters=[9, 16, 25, 36, 49],
    ensamMethod=[
        "kmeans",
        "gaussianMix",
        "kmedoids"
    ],
    random_seed=1,
    n_init=5,
    max_iter=300,
    algorithmMethod="lloyd",
    RBFKmeans=True,
    covariance_type="full",
    metric="euclidean"
)

model_rgb_auto.fit(train_df)

print(
    "Selected RGB representation size:",
    model_rgb_auto.n_clusters
)
The selected value is the candidate that maximizes image stability under the SSIM procedure. It should not be interpreted automatically as the value that maximizes classification or regression performance.
Structural stability is not predictive performance
This distinction is central.
A high SSIM score indicates that an image representation is reproducible under variations in random initialization. It does not demonstrate that:
- a CNN will achieve higher accuracy;
- a Vision Transformer will generalize better;
- a hybrid network will obtain a lower error;
- or the representation preserves all information relevant to the target variable.
SSIM is therefore best interpreted as a representation-stability criterion.
A complete experimental design should distinguish:
| Question | Appropriate evaluation |
|---|---|
| Is the representation stable across random initializations? | SSIM |
| Does the representation preserve useful predictive information? | Downstream validation/test metrics |
| Is the method computationally feasible? | Fit/transform time and memory |
| Does the conclusion generalize? | Multiple datasets, seeds and architectures |
| Is every channel useful? | Channel ablation |
| Does RGB fusion add information beyond a single view? | Controlled single-channel versus multi-channel comparison |
Actual stability profiles should be inspected
The final decision should not be reduced to the selected integer alone. It is useful to inspect the full stability profile across candidate values.
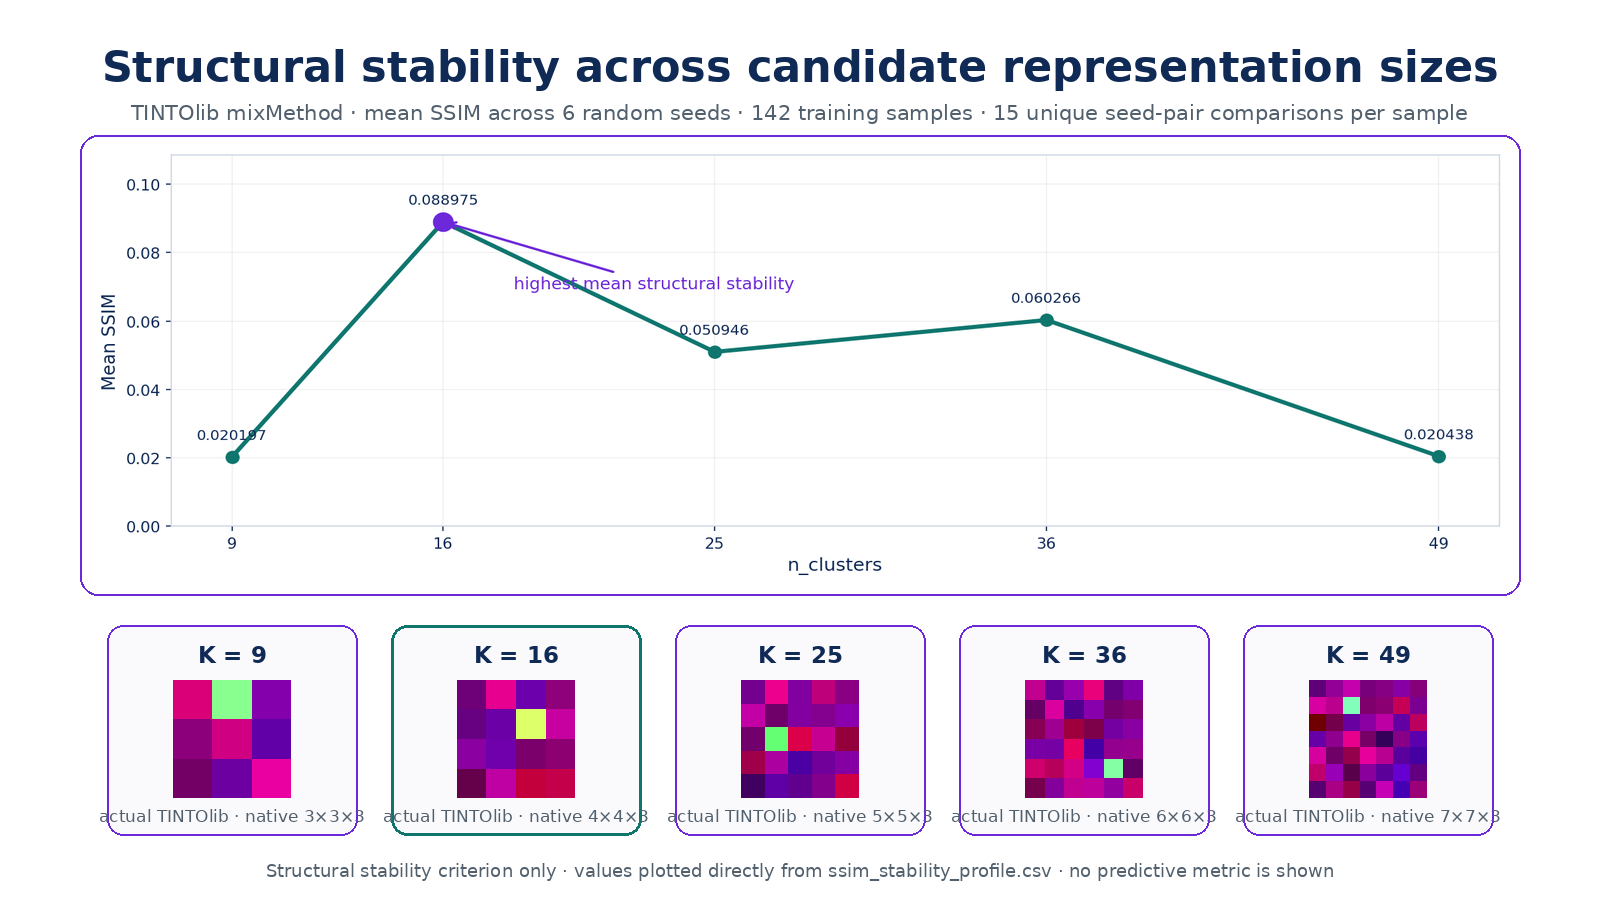 (Figure 5. Example of a structural-stability analysis across candidate values of
 n_clusters. The plot should be generated from actual TINTOlib outputs using the same training partition and repeated random initializations. The selected value corresponds to the highest mean SSIM; the figure reports representation stability only and does not constitute a predictive-performance ranking.)
Methodological cautions
1. Automatic selection belongs inside the training pipeline
The SSIM procedure must operate exclusively on the training partition. Candidate selection performed before the train/test split would expose the transformation-design stage to future evaluation samples.
The correct sequence remains:
- split the original tabular dataset;
- fit
Clusterson training data; - allow
fit()to selectn_clustersfrom training data when requested; - freeze the fitted transformation;
- transform validation and test partitions without refitting;
- evaluate the downstream architecture on untouched data.
2. Channel composition is itself a design choice
A three-channel image does not automatically contain more useful information than a grayscale image. The selected component methods may be complementary, partially redundant or poorly matched to the downstream architecture.
Channel composition should therefore be studied through controlled ablations such as:
- R only;
- R + G;
- R + B;
- G + B;
- R + G + B.
3. Channel ordering must be documented
The same methods in a different ensamMethod order produce a different RGB colour assignment. Reproducible experiments should report both the selected methods and their exact order.
4. Independent scaling changes the meaning of intensity
Every component method has its own training-derived scaling operation. Therefore, identical intensity values in two channels do not imply identical pre-scaling numerical meaning.
5. SSIM measures visual consistency, not semantic equivalence
Different unsupervised fits may produce representations that are mathematically related while differing in channel or component organization. SSIM quantifies the final image similarity and should therefore be interpreted specifically as a measure of output-image stability.
How should mixMethod be evaluated?
The most informative experiment is not to compare one RGB configuration against one grayscale method and declare a winner.
A stronger protocol would include:
- each selected component method independently;
- two-channel combinations;
- the complete three-channel representation;
- fixed versus SSIM-selected
n_clusters; - repeated random seeds;
- several downstream architectures;
- classical tabular baselines and an MLP;
- computational cost and storage requirements.
The experimental work that motivated the new Clusters family used regression, binary-classification and multiclass-classification datasets with a specific Vision Transformer evaluation pipeline. Those results provide evidence for that particular experimental setting, but they do not establish a universal ordering among transformations.
The same representation may behave differently with:
- CNNs;
- hybrid tabular–image architectures;
- alternative Vision Transformer configurations;
- different image resolutions;
- different optimizers or regularization strategies;
- datasets with different dimensionality and statistical structure.
For that reason, this series focuses on what each representation encodes, how it is generated and how it should be evaluated, rather than identifying a universally superior method.
Closing the four-part series
The four tutorials can now be read as a progression from single representations toward multi-view and stability-aware image generation.
| Part | Central question | Main concepts |
|---|---|---|
| I — From Clusters to Pixels | How can an unsupervised representation become an image? | Unified Clusters framework, seven algorithms, grayscale/RGB generation, leakage prevention |
| II — Distance-Based Encodings | How can proximity and local structure become pixels? | k-means, k-medoids, aggloKNN, metrics, ordering, RBF |
| III — Probabilities, Densities and Latent Factors | Which statistical quantities can replace raw distances? | Gaussian responsibilities, KDE densities, latent factor scores |
| IV — RGB Fusion and Structural Stability | How can several views be fused and their representation size selected? | mixMethod, channel semantics, RGB fusion, SSIM stability, automatic n_clusters |
Taken together, the Clusters family provides a common framework for transforming heterogeneous unsupervised descriptions into image-like representations suitable for experimentation with computer-vision and hybrid neural architectures.
Limitations and future directions
Several research directions remain open.
Automatic channel selection
mixMethod currently receives an explicit ensamMethod list. Future work could investigate whether the most informative combination of representations can itself be selected automatically.
Beyond fixed RGB fusion
RGB channels provide a convenient three-view interface, but they impose a fixed maximum of three simultaneous representations. Learned fusion layers, multi-branch networks or token-level fusion could combine a larger number of views without forcing them into conventional colour channels.
Stability and predictive utility
SSIM evaluates structural consistency across random initializations. A future selection criterion could combine representation stability with downstream predictive evidence while maintaining a strictly leakage-free validation protocol.
Component alignment
Probabilistic and latent models may contain ordering or orientation ambiguities across independent fits. Alignment strategies could be investigated before structural-comparison procedures in order to separate genuine instability from equivalent but differently indexed representations.
Broader neural evaluation
The experimental study behind these additions used a particular Vision Transformer architecture. Further work should systematically evaluate the methods with CNNs, hybrid tabular–image architectures, alternative ViTs and other visual backbones before drawing broad conclusions about their relative behaviour.
Explainable multi-view representations
Because each RGB channel has a known origin, attribution maps from the downstream visual model could potentially be decomposed by channel and connected back to centroid proximity, component responsibilities, medoid distances or latent factors. This creates a promising direction for explainable multi-view tabular learning.
Conclusion
mixMethod and SSIM-based automatic selection complete the conceptual framework introduced throughout this series.
mixMethod combines up to three compatible unsupervised descriptions of the same sample in a single RGB image. The resulting colours are not arbitrary decorations: each channel originates from a different learned representation and must be interpreted according to its own statistical meaning.
The SSIM procedure addresses another design question: how large should the learned representation be? Instead of selecting n_clusters only from an internal clustering objective, TINTOlib can evaluate how structurally stable the final synthetic images remain across different random initializations.
Neither mechanism guarantees better predictive performance. They provide additional tools for designing, controlling and analysing synthetic representations of tabular data. Their value must ultimately be established through leakage-free experiments across datasets, seeds and downstream architectures.
The broader message of the series is therefore simple: representation design is part of the learning problem. Once tabular data are transformed into images, the transformation itself should be studied with the same rigor as the neural architecture that consumes those images.
References and resources
Salvador Martínez Moreno. Generación de imágenes sintéticas mediante métodos no supervisados para la librería TINTOlib. Master’s Thesis, Universidad Nacional de Educación a Distancia (UNED), 2026.
TINTOlib documentation. Clusters. Read the current parameter and API documentation.
Research articles
Jiayun Liu, Manuel Castillo-Cara, Raúl García-Castro, Luis Orozco-Barbosa. Interpretable Hybrid Vision Transformer Architectures for MIMO-Based Indoor Localization using Synthetic Spatial Representations. IEEE Internet of Things. DOI: 10.1109/JIOT.2026.3696106
Jiayun Liu, Manuel Castillo-Cara, Raúl García-Castro. A Comprehensive Benchmark of Spatial Encoding Methods for Tabular Data with Deep Neural Networks. Information Fusion. DOI: 10.1016/j.inffus.2025.104088
Giovanny Mondragon-Ruiz, Jiayun Liu, Manuel Castillo-Cara, Raúl García-Castro. Interpretable CNN–KAN hybrid architectures for tabular data with synthetic image encoding. Information Processing and Management. DOI: 10.1016/j.ipm.2026.104954
Felipe Escalera-González, Manuel Castillo-Cara, Mariano Rincón-Zamorano, Luis Orozco-Barbosa. PermGrad: Interpretable Hybrid Neural Networks with synthetic images for tabular data. Knowledge-Based Systems. DOI: 10.1016/j.knosys.2026.116507
Manuel Castillo-Cara, Jesus Martínez-Gómez, Javier Ballesteros-Jerez, Ismael García-Varea, Raúl García-Castro, Luis Orozco-Barbosa. MIMO-Based Indoor Localisation with Hybrid Neural Networks. IEEE Journal of Selected Topics in Signal Processing. DOI: 10.1109/JSTSP.2025.3555067
Reewos Talla-Chumpitaz, Manuel Castillo-Cara, Luis Orozco-Barbosa, Raúl García-Castro. Blurring Image Techniques for Bluetooth-based Indoor Localisation. Information Fusion. DOI: 10.1016/j.inffus.2022.10.011
Software articles
Jiayun Liu, David González-Fernández, Manuel Castillo-Cara, Raúl García-Castro. TINTOlib: A Python library for transforming tabular data into synthetic images for deep neural networks. SoftwareX. DOI: 10.1016/j.softx.2025.102444
Manuel Castillo-Cara, Reewos Talla-Chumpitaz, Raúl García-Castro, Luis Orozco-Barbosa. TINTO: Converting Tidy Data into Image for Classification with 2-Dimensional Convolutional Neural Networks. SoftwareX. DOI: 10.1016/j.softx.2023.101391
Continue learning Artificial Intelligence
Explore practical courses on AI, Machine Learning, Deep Learning, Python, R and applied data science.

© Manuel Castillo-Cara, PhD. Content licensed under CC BY-NC 4.0 unless otherwise stated.