TINTOlib · Synthetic Images · Tabular Data
Improving Deep Learning by Exploiting Synthetic Images
Part I — Why tabular data remains a difficult domain for deep learning, and why representation is the central methodological problem.
- Author: Manuel Castillo-Cara, PhD
- Affiliation: Dpt. of Artificial Intelligence, Universidad Nacional de Educación a Distancia (UNED), Spain
- Role: Researcher, Professor, and TINTOlib Python Library Developer
- License: CC BY-NC 4.0 unless otherwise stated.
Video overview
This post is part of a two-part technical summary derived from the conference Improving Deep Learning by Exploiting Synthetic Images, delivered in Peru.
The following short video provides an English overview of the main ideas discussed across both posts: why tabular data remains challenging for deep learning, how synthetic images can introduce spatial representations, and how TINTOlib connects structured data with computer vision, hybrid neural networks and explainable AI.
Additional material. The original conference recording is available in Spanish. The two blog posts provide an English technical synthesis and discussion based on that conference.
Introduction: why another post on synthetic images?
Most introductions to deep learning start from domains where the data already have a rich native structure: images, text, audio, video or graphs. In those domains, the input representation is not merely a container of values; it already carries some form of organization. Pixels are arranged in a plane. Words appear in sequences. Audio samples evolve over time. Graphs encode nodes and edges.
Tabular data are different. A table is one of the most common data structures in science, industry and public administration, but its geometry is weakly defined. Rows represent samples and columns represent variables, yet the order of those variables is usually arbitrary. A tabular dataset may contain age, sex, income, biomarkers, signal measurements, sensor values or derived indicators, but the fact that one column appears before another rarely means that both variables are spatial neighbours.
This creates a paradox. Deep learning has transformed computer vision, natural language processing and generative modelling, but for many tabular problems classical machine learning models remain extremely strong. Random Forest, XGBoost, LightGBM and CatBoost are still difficult baselines to beat. The problem is not simply that deep learning is less powerful. The problem is that many of its most successful architectures are designed to exploit structure that tabular data do not naturally provide.
The theoretical question addressed in the conference, and in this post, is therefore the following:
Can we improve deep learning on tabular data by constructing a meaningful spatial representation before applying the neural architecture?
This question is the starting point for tabular-to-image transformation, synthetic image generation from structured data and the TINTOlib framework.
Data science as a transformation from data to knowledge
A useful way to frame data science is to see it as a transformation pipeline: data are collected, curated, represented, modelled and interpreted in order to produce knowledge. This knowledge should not be limited to a numerical prediction. It should be reproducible, generalizable and sufficiently interpretable to support scientific or operational decisions.
In practice, the first difficulty is that real-world data are heterogeneous. Data may arrive as images, time series, text, graphs or tables. In many institutional and industrial scenarios, however, the dominant format is tabular. Corporate databases, biomedical registries, educational records, indoor localisation measurements, sensor logs and many scientific datasets are naturally stored as tables.
This is why the tabular domain is so important. A method that improves learning from tabular data can have impact across many applied areas. At the same time, this is why the problem is difficult. Tabular datasets often combine numerical and categorical variables, heterogeneous scales, missing values, non-linear dependencies, interactions between variables and relatively small sample sizes compared with modern image or language datasets.
(Figure 1. Motivation of the tabular data bottleneck. A large fraction of real-world organisational and scientific data is stored in tabular form, yet standard deep learning architectures do not naturally exploit this representation. The key methodological challenge is to transform structured data into representations that preserve variable relationships while remaining suitable for modern neural architectures.)
The central claim of this post is that representation is not a secondary detail. It is a fundamental modelling decision. If the representation is inadequate, even a powerful neural architecture may fail to exploit the relevant structure of the problem.
Why CNNs and ViTs work so well on images
To understand why tabular data are difficult, it is useful to recall why deep learning works so well in computer vision.
A natural image has spatial locality. Neighbouring pixels tend to be related. They may belong to the same edge, texture, object or background region. CNNs exploit this property through convolutional filters that slide across the image. These filters detect local patterns and reuse them across different spatial positions. This creates an architectural prior: the model assumes that local structures matter and that patterns can appear in different parts of the image.
Vision Transformers follow a different strategy, but they also assume an organized visual representation. An image is divided into patches, each patch is embedded, and attention mechanisms learn relationships between patches. The model is not restricted to local filters in the same way as a CNN, but it still begins from a spatially arranged representation.
In both cases, the input representation supports the architecture. The image is not just a vector. It is a structured object.
A raw tabular dataset does not provide this kind of support. If a table is treated as an image by simply reshaping columns into a matrix, the resulting arrangement may be arbitrary. The position of a feature in the synthetic grid may depend on column order rather than on meaningful relationships. This is precisely the problem that tabular-to-image methods attempt to solve.
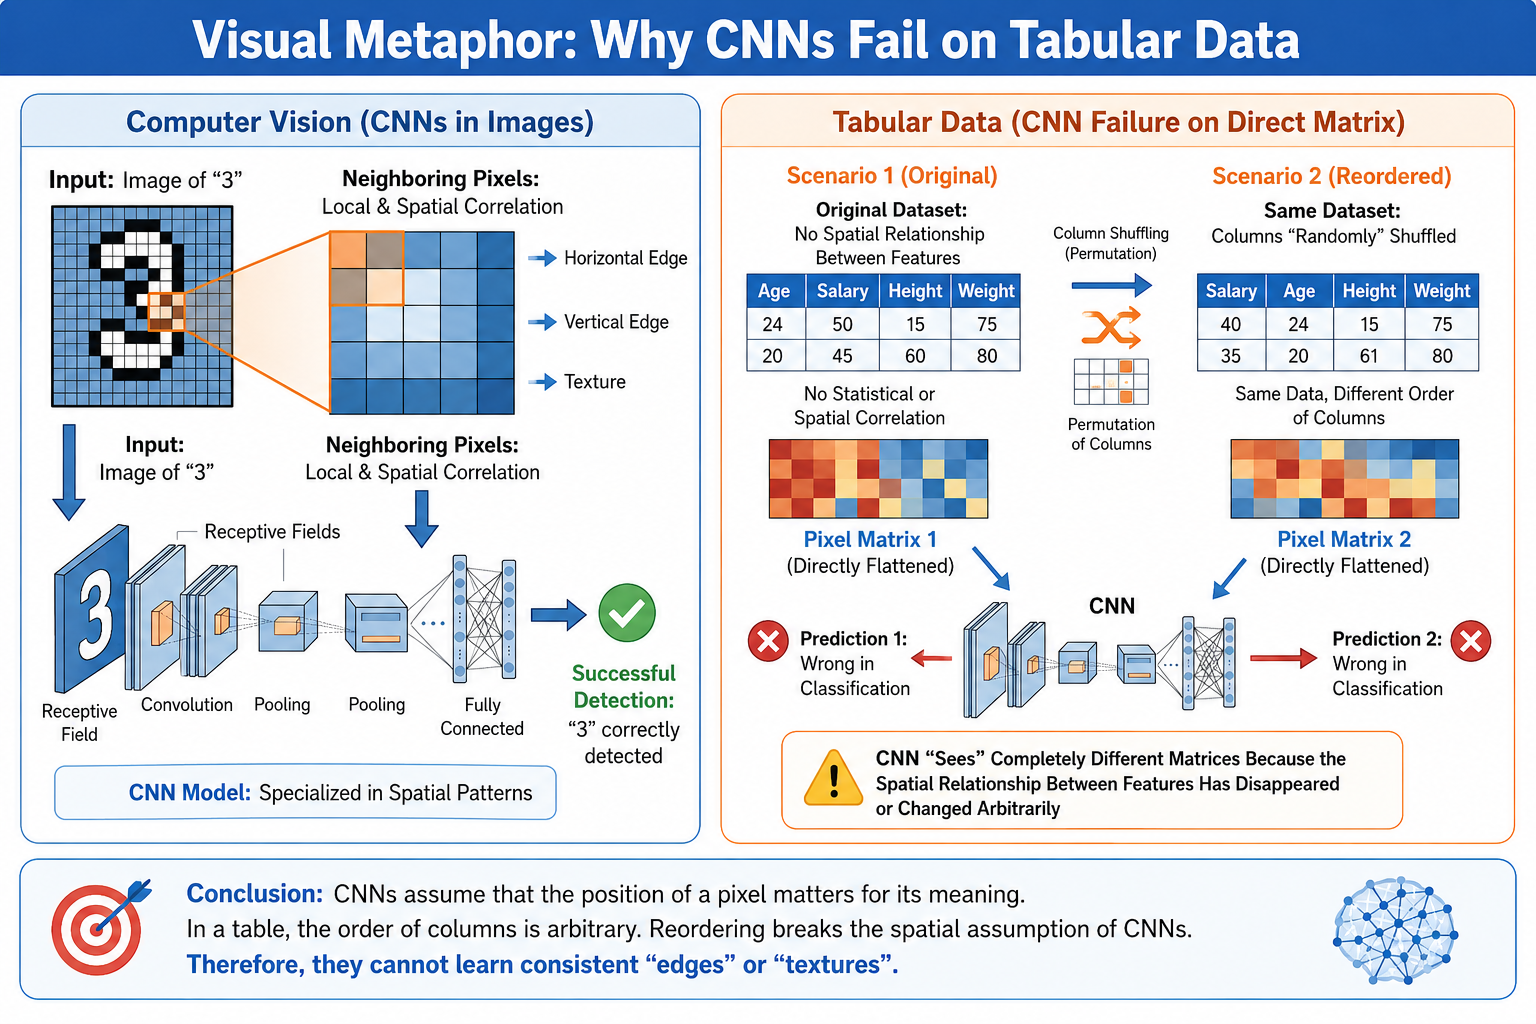
(Figure 2. Visual metaphor illustrating why CNNs are not directly suited to raw tabular matrices. In natural images, neighbouring pixels encode meaningful local and spatial correlations, allowing convolutional filters to detect edges, textures and shapes. In tabular data, however, column order is usually arbitrary: reordering variables such as age, salary or sex changes the apparent pixel arrangement while preserving the semantic content of the sample. A CNN applied directly to such a matrix may therefore learn artefacts induced by column order rather than meaningful feature interactions.)
This visual metaphor is also important when evaluating tabular-to-image transformation methods. A method that simply converts a table into an image without solving the ordering problem may still expose a CNN to an arbitrary geometry. The objective is not only to obtain an image, but to construct a spatial representation whose neighbourhoods have methodological meaning.
Why tabular data remains the difficult domain
Deep learning on tabular data is not impossible. There are many neural architectures for structured data, including MLPs, attention-based models, entity embeddings, differentiable trees and transformer variants for tables. However, the empirical picture remains complex. In many benchmarks, strong ensemble models still outperform standard neural networks.
There are several reasons for this.
First, tabular datasets are often small or medium-sized. Deep neural networks usually benefit from large-scale data, while many tabular problems contain hundreds, thousands or tens of thousands of samples rather than millions.
Second, tabular features are heterogeneous. Some are continuous, others categorical, ordinal, binary or derived. Their scales and distributions may differ substantially.
Third, interactions between variables can be sparse, non-linear and dataset-specific. A variable may be informative only in combination with another variable, or only for a subset of the population.
Fourth, tabular data have no canonical spatial arrangement. Unlike images, tables do not tell us which variables should be neighbours.
This fourth point is especially relevant for the synthetic image paradigm. If a CNN is to process a tabular sample as an image, the image must not be an arbitrary reshaping of the table. It must be a constructed representation in which spatial proximity has methodological meaning.
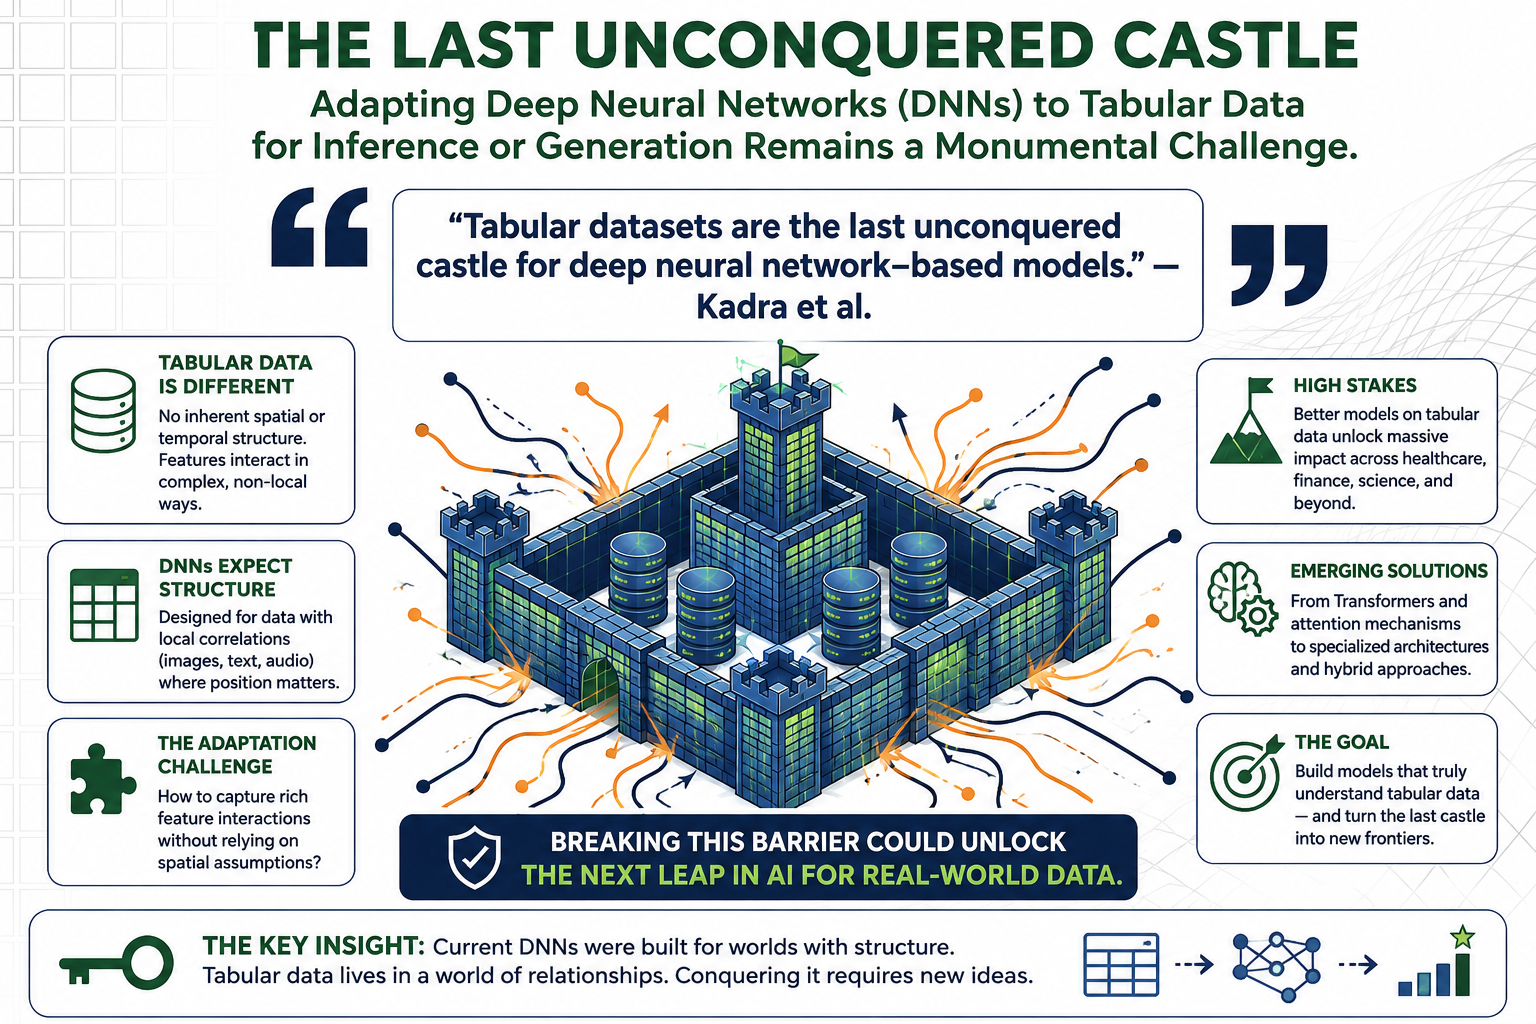 (Figure 3. Deep learning for tabular data as an open research problem. Although deep neural networks have achieved remarkable success in computer vision, natural language processing and generative AI, tabular data remain a challenging domain where ensemble methods are still strong baselines. This motivates the search for alternative representations rather than naive applications of generic neural architectures.)
The central problem is not the model; it is the representation
A frequent mistake is to treat model selection and data representation as independent decisions. In reality, architecture and representation are deeply coupled.
A CNN is not simply a classifier. It is a classifier designed for spatially organized data. A ViT is not simply an attention mechanism. It assumes a patch-based visual input. A recurrent neural network assumes a sequence. A graph neural network assumes a graph.
Therefore, when applying deep learning to tabular data, we must ask what structure the model is expected to exploit. If no structure is provided, the model must infer everything from scratch. If an arbitrary structure is imposed, the model may learn artifacts.
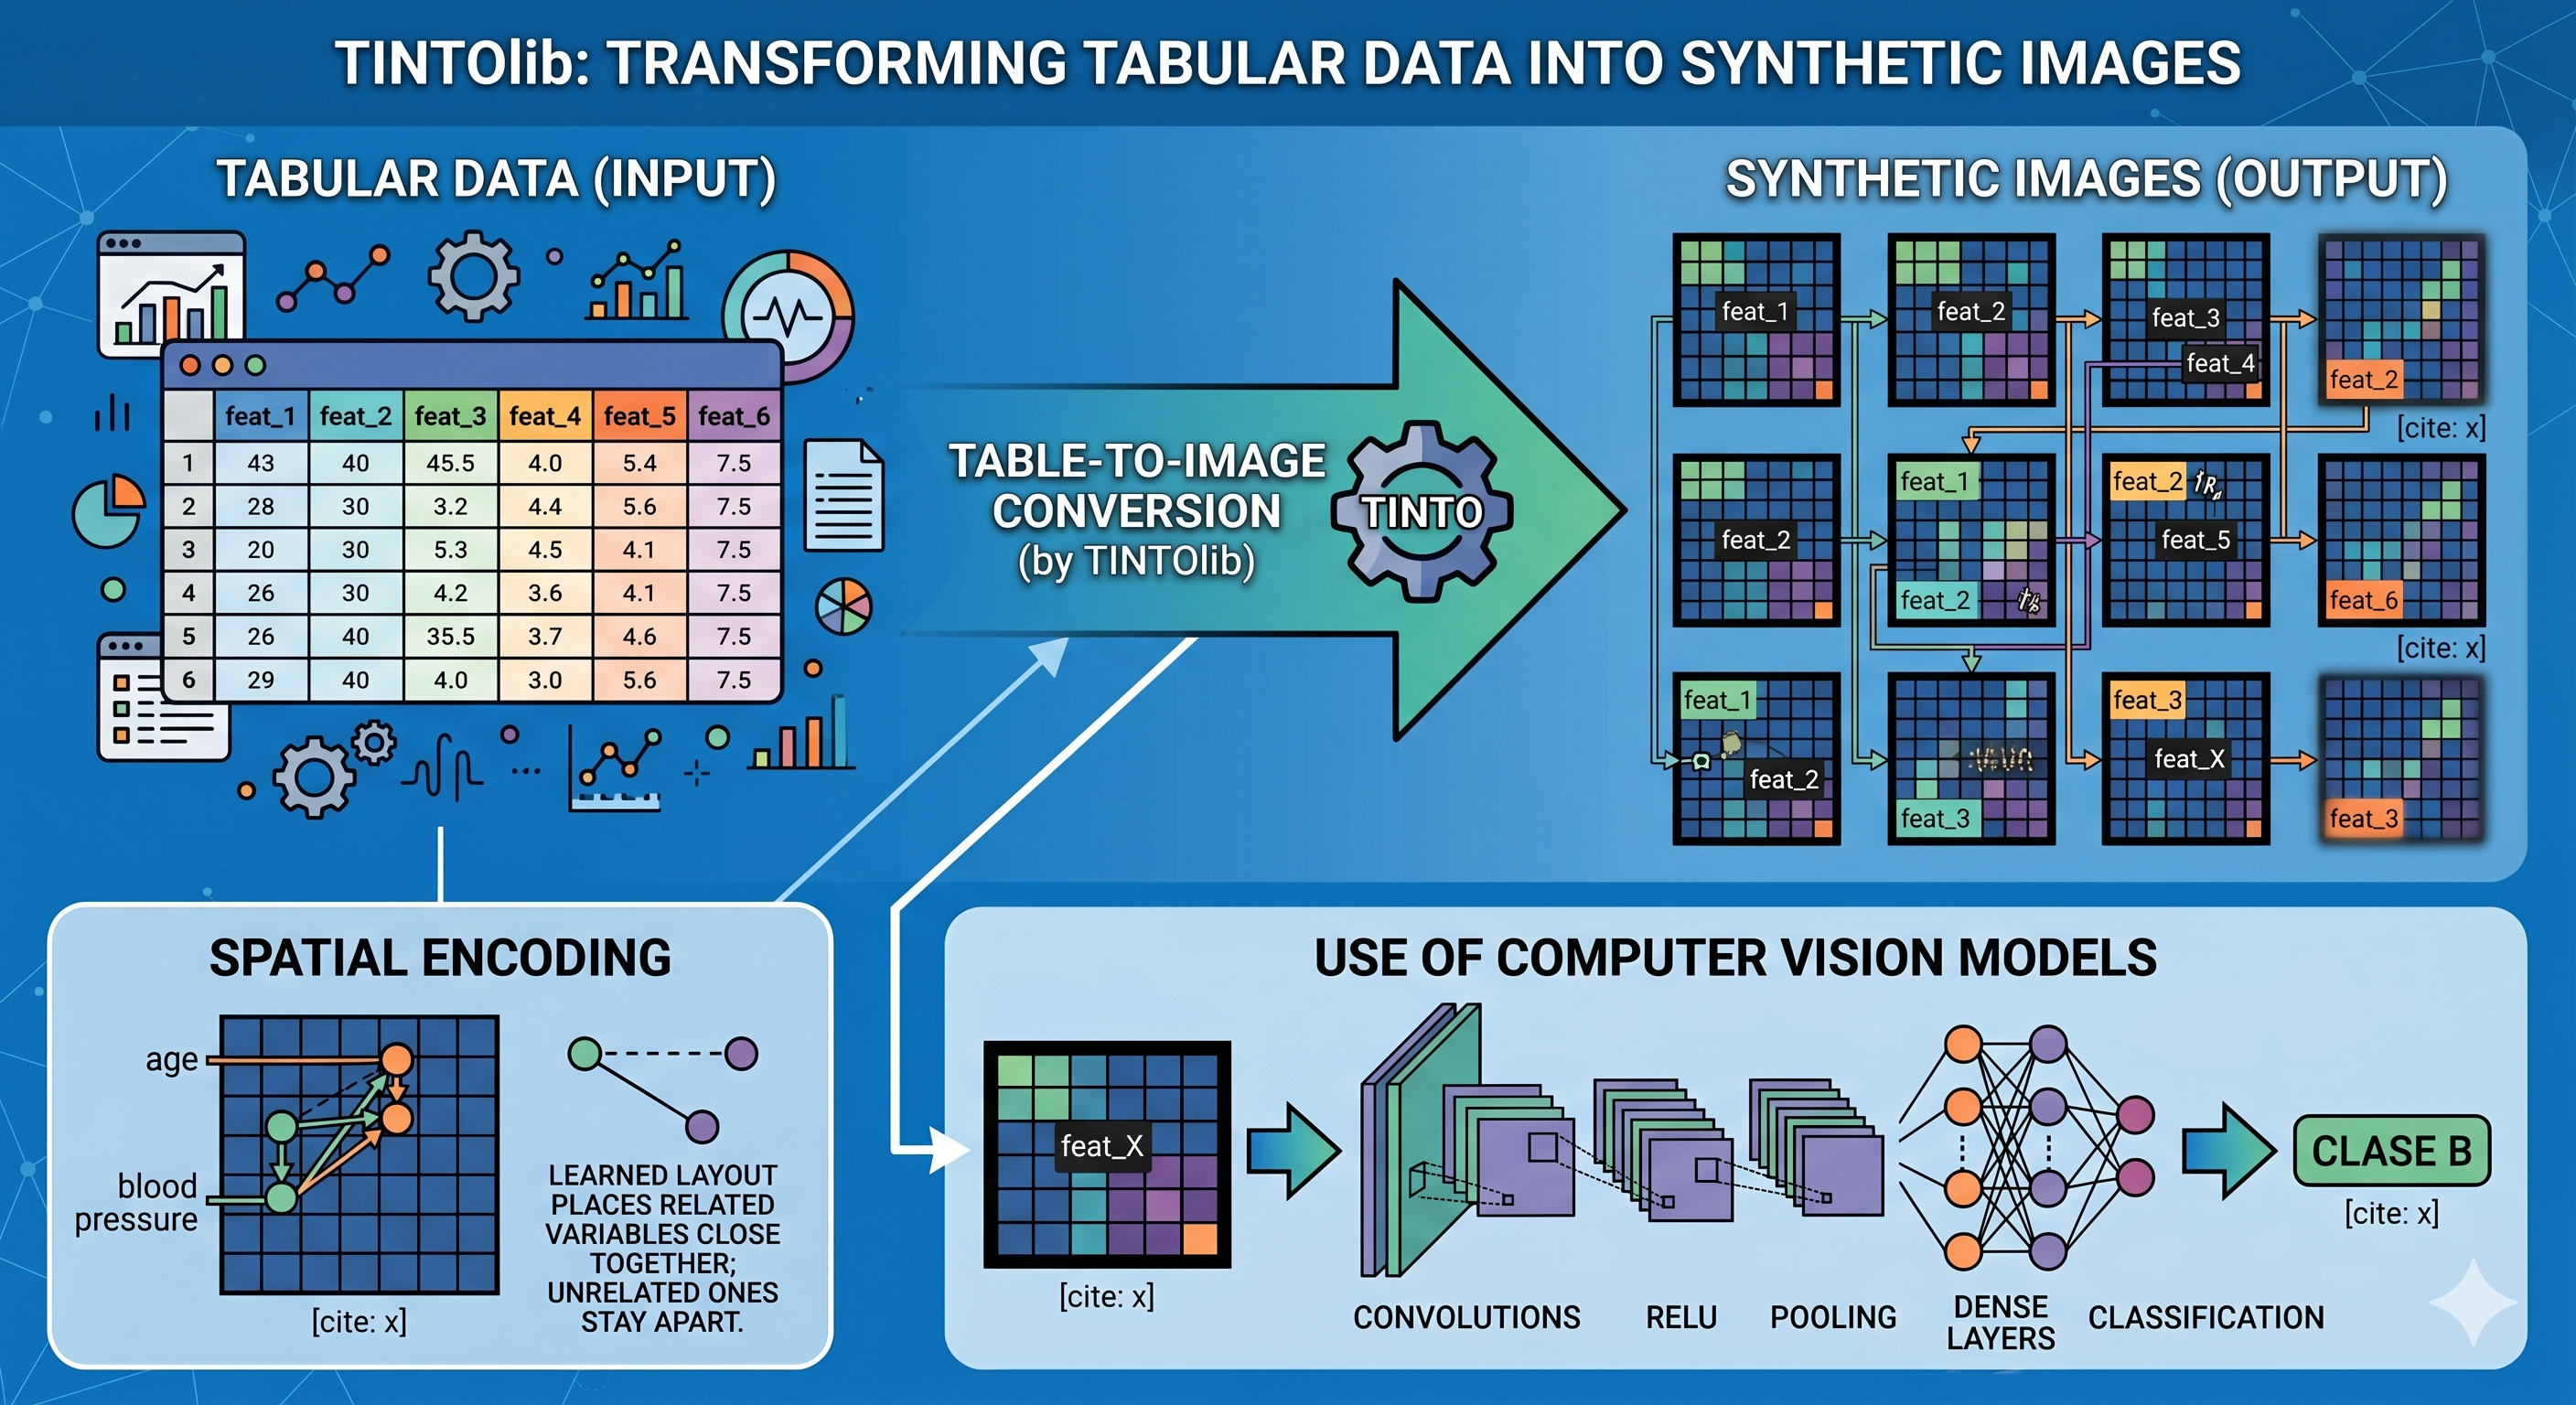
Synthetic image generation is a representation strategy. It proposes that instead of forcing a neural network to process a raw table, we first map the table into a spatial domain. Then we can use visual architectures in a more coherent way.
The resulting image is not natural. It is synthetic. It does not represent a physical scene. It represents the values of a tabular instance arranged according to a spatial encoding of the variables.
From tabular vectors to synthetic images
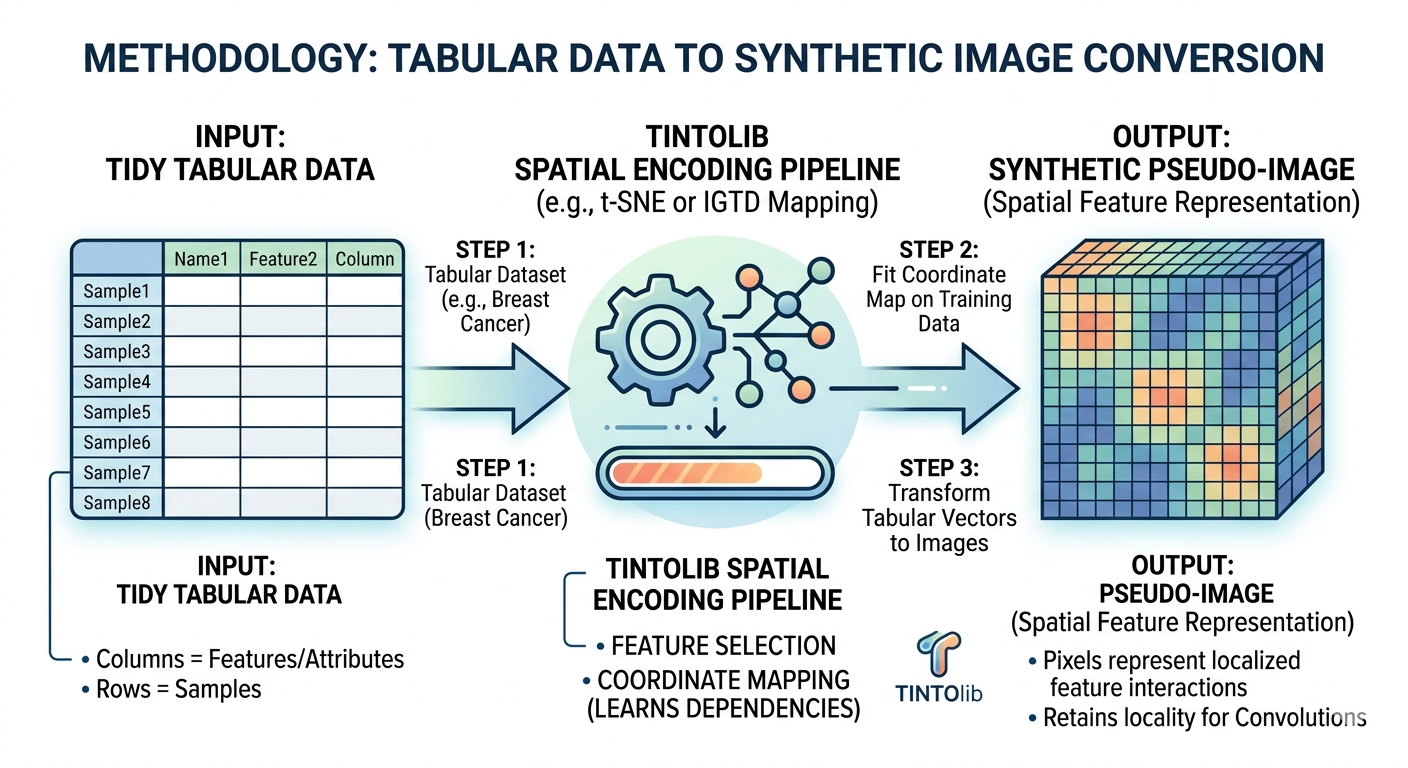
The transformation can be understood in two stages.
First, the method learns or defines a spatial layout of the features. Each feature is assigned a position in a two-dimensional grid. Ideally, features that are statistically, geometrically or semantically related should be placed close to one another.
Second, each sample is projected into that grid. The feature values of the sample become pixel intensities or spatial patterns, producing a synthetic image.
Tabular dataset
    |
    | learn feature layout
    v
2D feature map
    |
    | project each sample
    v
Synthetic image dataset
    |
    | CNN / ViT / hybrid neural network
    v
Prediction and explanation
This transformation does not claim that tabular data are images. Rather, it constructs an image-like representation that allows the use of architectures developed for the visual domain.
The methodological quality of the approach depends heavily on how the feature layout is constructed. A good transformation should reduce arbitrariness. A poor transformation may simply reproduce the arbitrary ordering of the original table.
A necessary distinction: spatially informed methods vs. order-dependent methods
This distinction is crucial.
Some tabular-to-image methods are strongly influenced by the original order or structure of the table. Examples include BarGraph, DistanceMatrix, Combination, SuperTML, BIE and FeatureWrap. These methods may be useful as baselines or didactic examples, but they should be used with caution as primary transformation strategies when the feature order is arbitrary.
The reason is methodological. If the generated image depends on whether age appears before or after sex, then the transformation inherits the same limitation that motivated the problem in the first place: tabular data do not possess a natural spatial order. In that case, the synthetic image may encode artifacts of the column arrangement rather than meaningful relationships between variables.
This does not mean that these methods are never useful. They can be relevant when the input table has a meaningful pre-existing order, when the objective is educational, or when they are included as comparative baselines. However, for rigorous tabular-to-image modelling, they should not be treated as the preferred family of methods if the feature ordering is arbitrary.
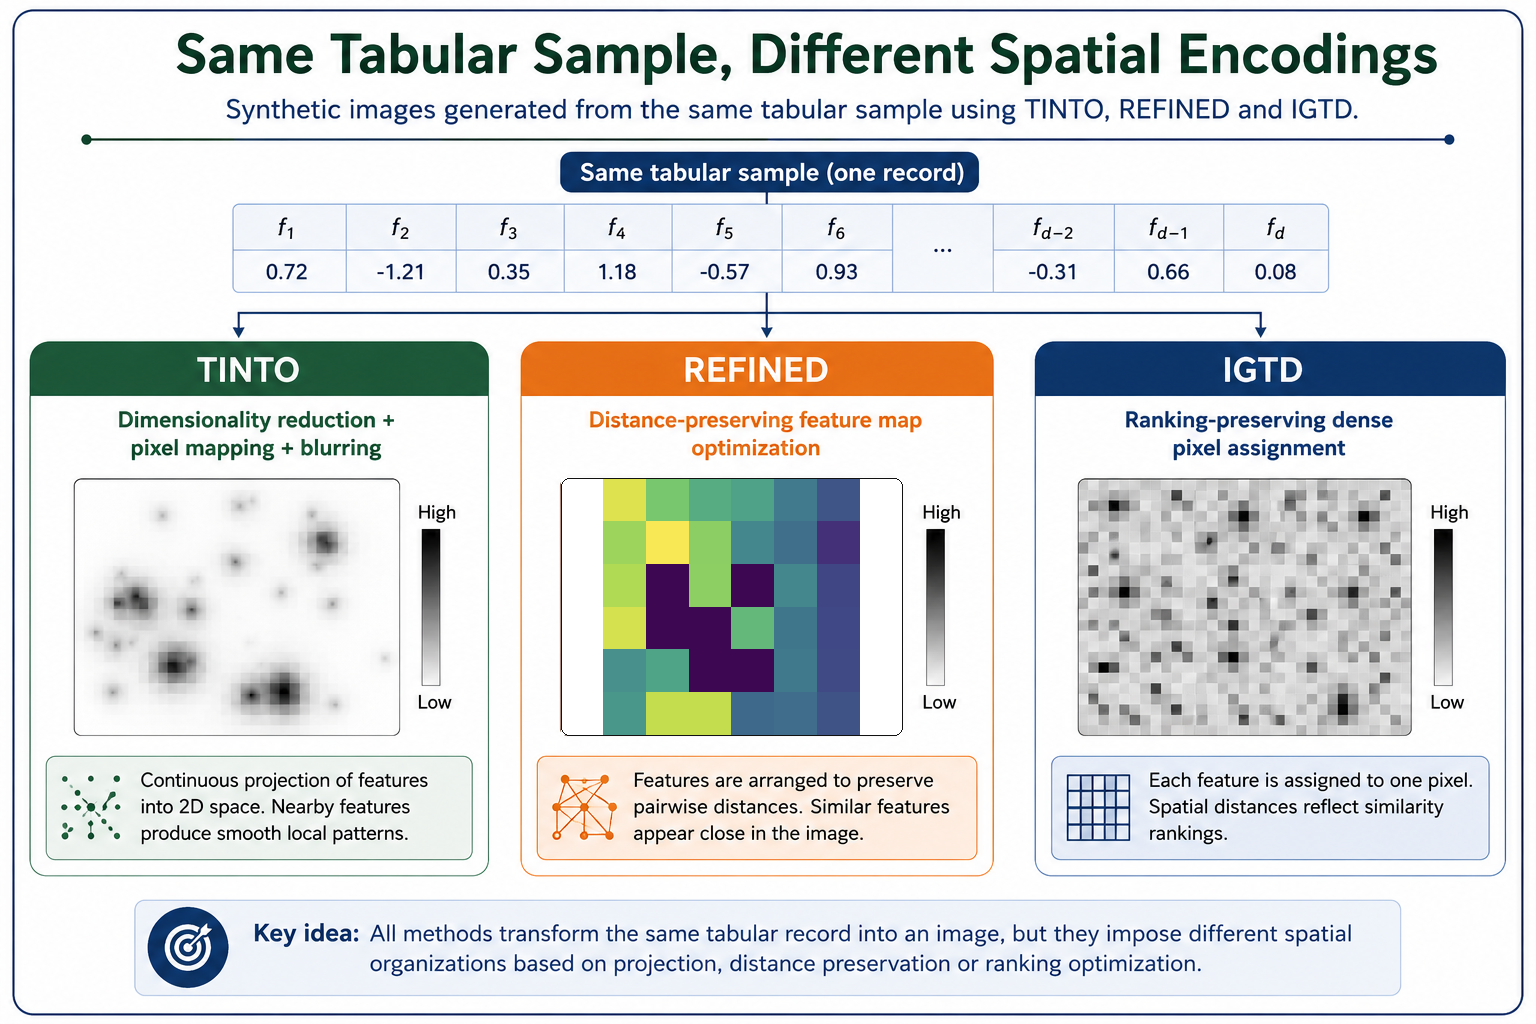
In contrast, methods such as TINTO, DeepInsight, IGTD, REFINED, Fotomics and recent unsupervised learning-based approaches such as ILUSTRE/ILUSTRES aim to construct the spatial representation from the data structure itself. These methods attempt to reduce dependence on the original column order by learning or optimizing the spatial arrangement of features. Their goal is precisely to create a meaningful visual representation where the geometry reflects relationships in the data, not the accidental ordering of the spreadsheet.
This distinction should be made explicit in any serious discussion of synthetic images for tabular data. The key question is not only whether a method produces an image. The key question is whether the image has a defensible spatial structure.
The paradigm shift
The paradigm shift introduced by TINTOlib can therefore be understood as a representational shift. Instead of applying deep learning directly to unordered tabular vectors, the method first constructs a spatial representation where feature relationships can be expressed geometrically. Once this representation exists, computer vision architectures can be applied under assumptions that are more coherent with their original design.
This does not mean that synthetic images are universally superior to classical tabular models. Rather, it means that they create a new experimental space: one in which tabular data can be studied through visual, hybrid and explainable neural architectures.
From a teaching perspective, this paradigm is also useful because it makes the problem visible. Students can compare different spatial encodings, inspect the resulting images and observe how representation affects the behaviour of the model.
What Part II will cover
This first part has focused on the theoretical motivation: why tabular data remain difficult for deep learning, why representation matters, and why spatially meaningful synthetic images are different from arbitrary reshaping.
In the second part, we will move from the conceptual problem to the modelling pipeline. We will discuss how TINTOlib operationalizes this paradigm, how different transformation methods should be compared, how hybrid neural networks combine tabular and visual branches, and how visual explainability methods can be adapted to synthetic tabular images.
Continue with Part II: From Synthetic Images to Hybrid Neural Networks
References and related publications
The concepts presented in this tutorial are connected to the following research and software publications on TINTO, TINTOlib, tabular-to-image transformation, synthetic spatial representations, hybrid neural networks, indoor localisation and explainable artificial intelligence.
Research articles
Jiayun Liu, Manuel Castillo-Cara, Raúl García-Castro, Luis Orozco-Barbosa. Interpretable Hybrid Vision Transformer Architectures for MIMO-Based Indoor Localization using Synthetic Spatial Representations. IEEE Internet of Things. DOI: 10.1109/JIOT.2026.3696106
Jiayun Liu, Manuel Castillo-Cara, Raúl García-Castro. A Comprehensive Benchmark of Spatial Encoding Methods for Tabular Data with Deep Neural Networks. Information Fusion. DOI: 10.1016/j.inffus.2025.104088
Giovanny Mondragon-Ruiz, Jiayun Liu, Manuel Castillo-Cara, Raúl García-Castro. Interpretable CNN–KAN hybrid architectures for tabular data with synthetic image encoding. Information Processing and Management. DOI: 10.1016/j.ipm.2026.104954
Felipe Escalera-González, Manuel Castillo-Cara, Mariano Rincón-Zamorano, Luis Orozco-Barbosa. PermGrad: Interpretable Hybrid Neural Networks with synthetic images for tabular data. Knowledge-Based Systems. DOI: 10.1016/j.knosys.2026.116507
Manuel Castillo-Cara, Jesus Martínez-Gómez, Javier Ballesteros-Jerez, Ismael García-Varea, Raúl García-Castro, Luis Orozco-Barbosa. MIMO-Based Indoor Localisation with Hybrid Neural Networks. IEEE Journal of Selected Topics in Signal Processing. DOI: 10.1109/JSTSP.2025.3555067
Reewos Talla-Chumpitaz, Manuel Castillo-Cara, Luis Orozco-Barbosa, Raúl García-Castro. Blurring Image Techniques for Bluetooth-based Indoor Localisation. Information Fusion. DOI: 10.1016/j.inffus.2022.10.011
Software articles
Jiayun Liu, David González-Fernández, Manuel Castillo-Cara, Raúl García-Castro. TINTOlib: A Python library for transforming tabular data into synthetic images for deep neural networks. SoftwareX. DOI: 10.1016/j.softx.2025.102444
Manuel Castillo-Cara, Reewos Talla-Chumpitaz, Raúl García-Castro, Luis Orozco-Barbosa. TINTO: Converting Tidy Data into Image for Classification with 2-Dimensional Convolutional Neural Networks. SoftwareX. DOI: 10.1016/j.softx.2023.101391
Continue learning Artificial Intelligence
Explore practical courses on AI, Machine Learning, Deep Learning, Python, R and applied data science.

© Manuel Castillo-Cara, PhD. Content licensed under CC BY-NC 4.0 unless otherwise stated.