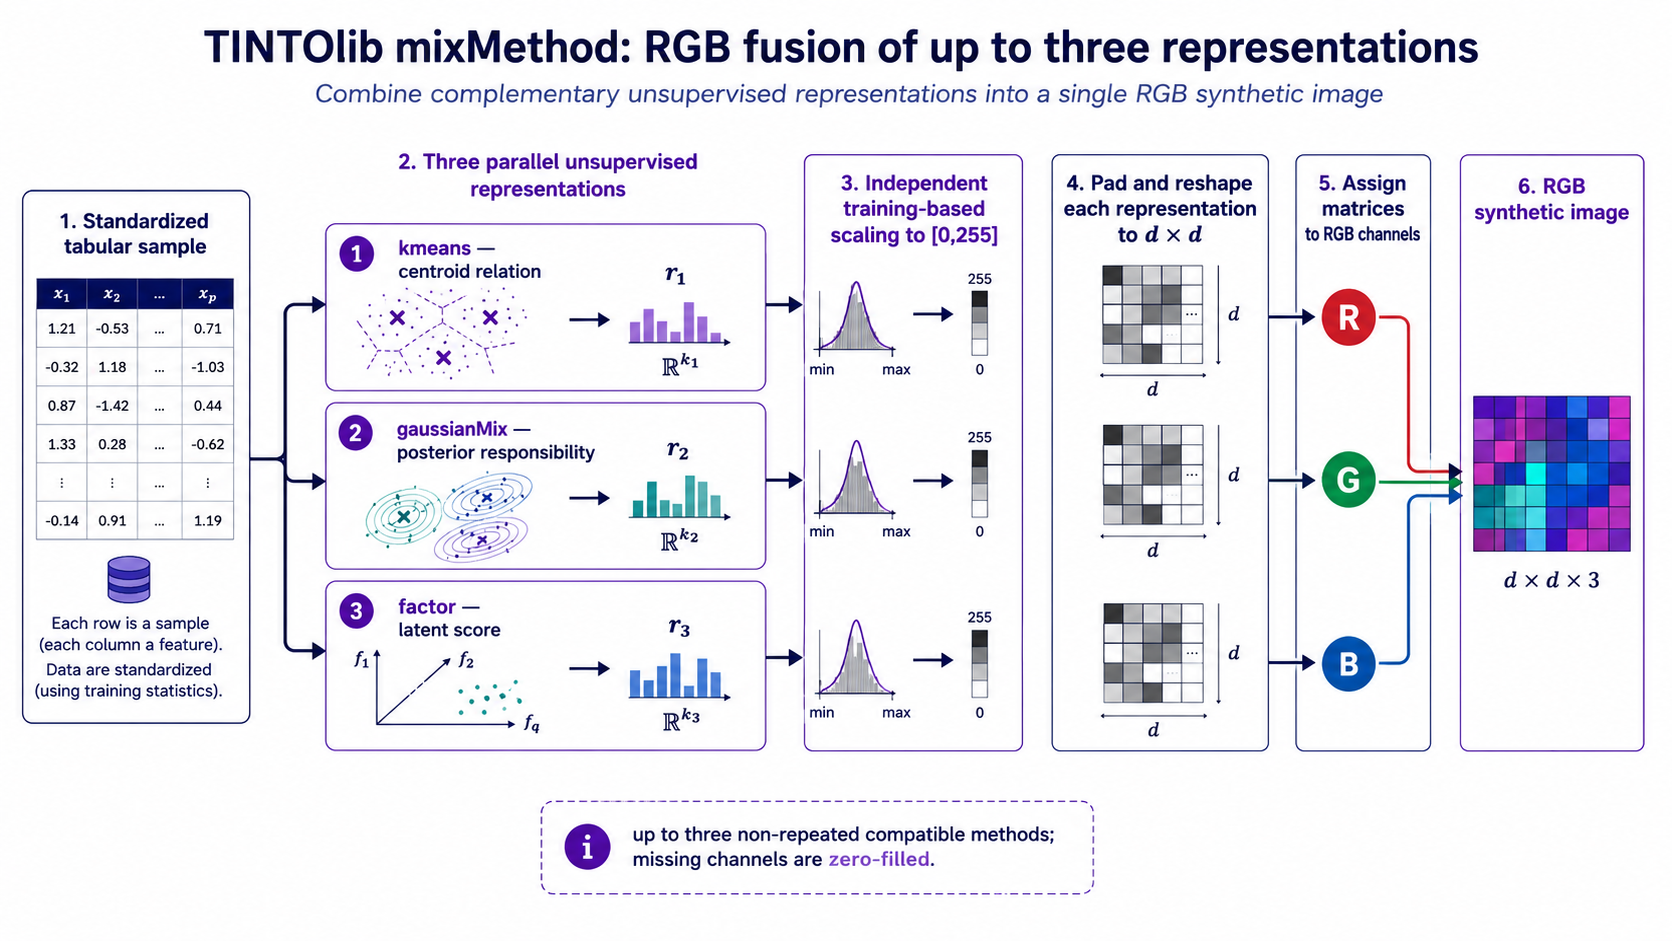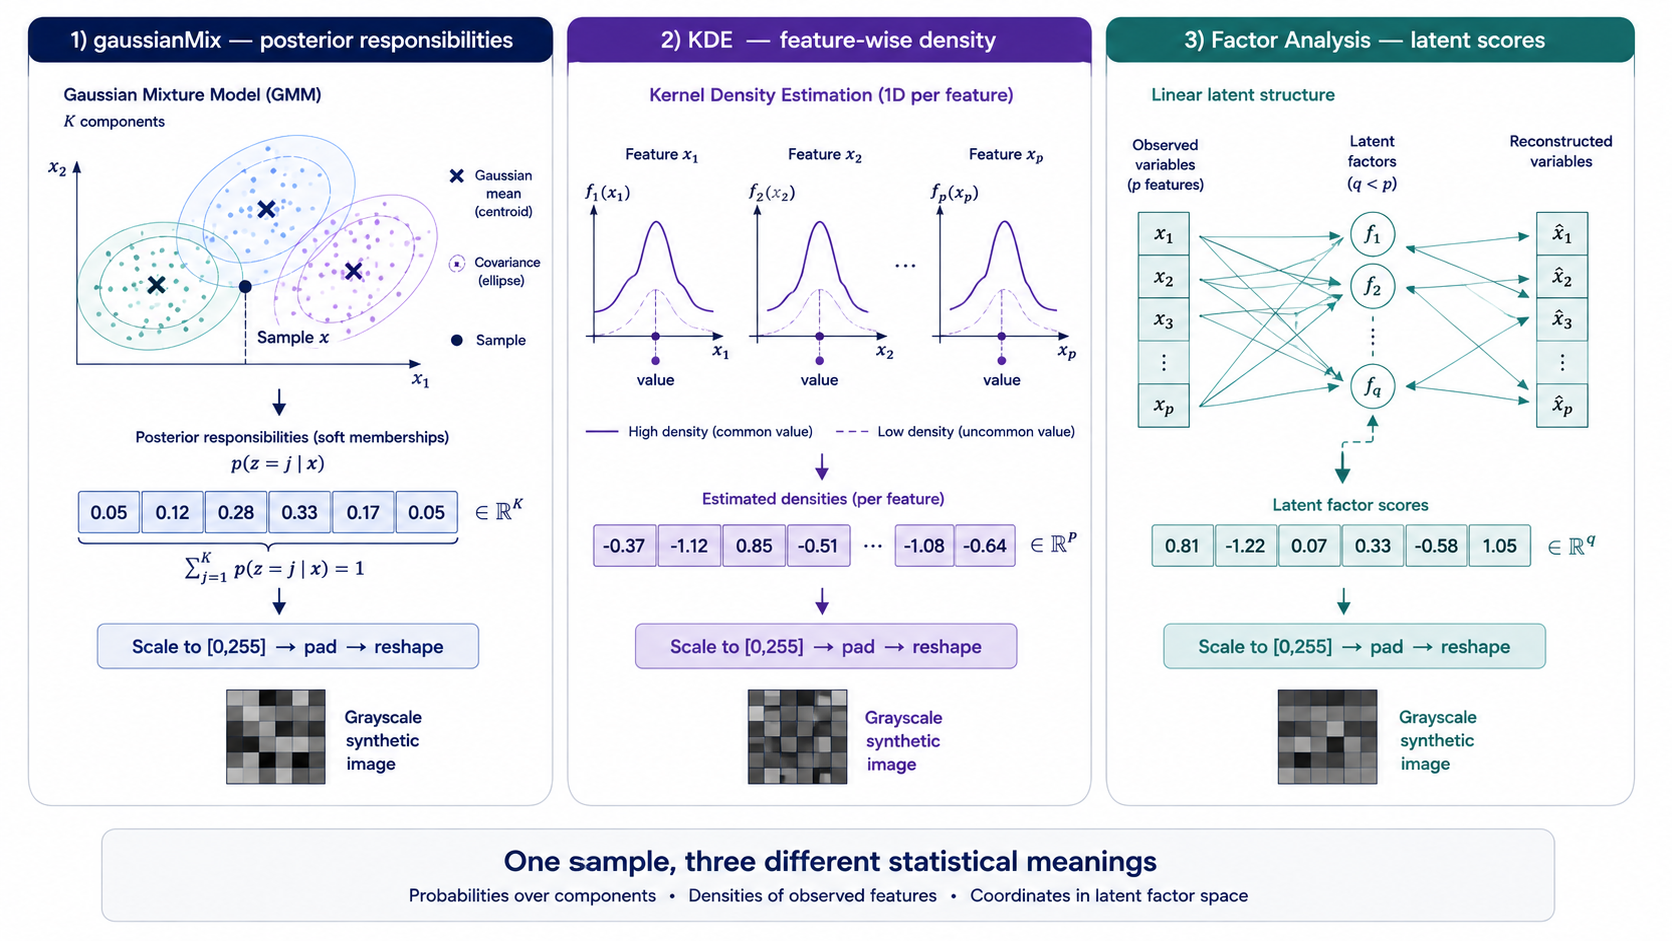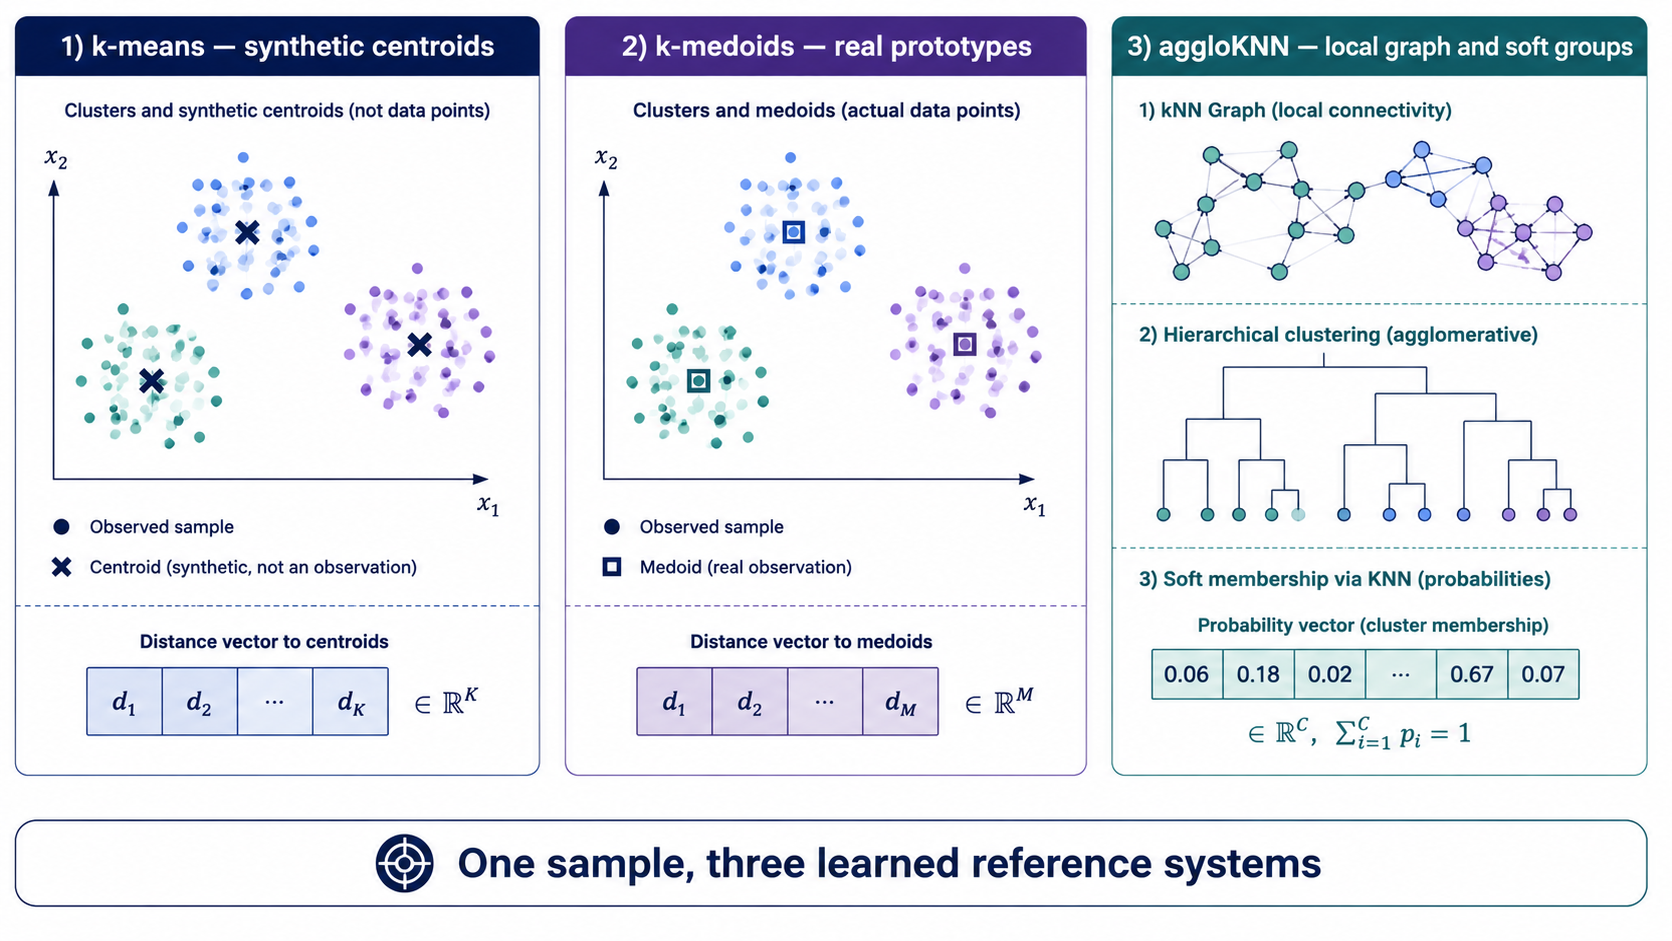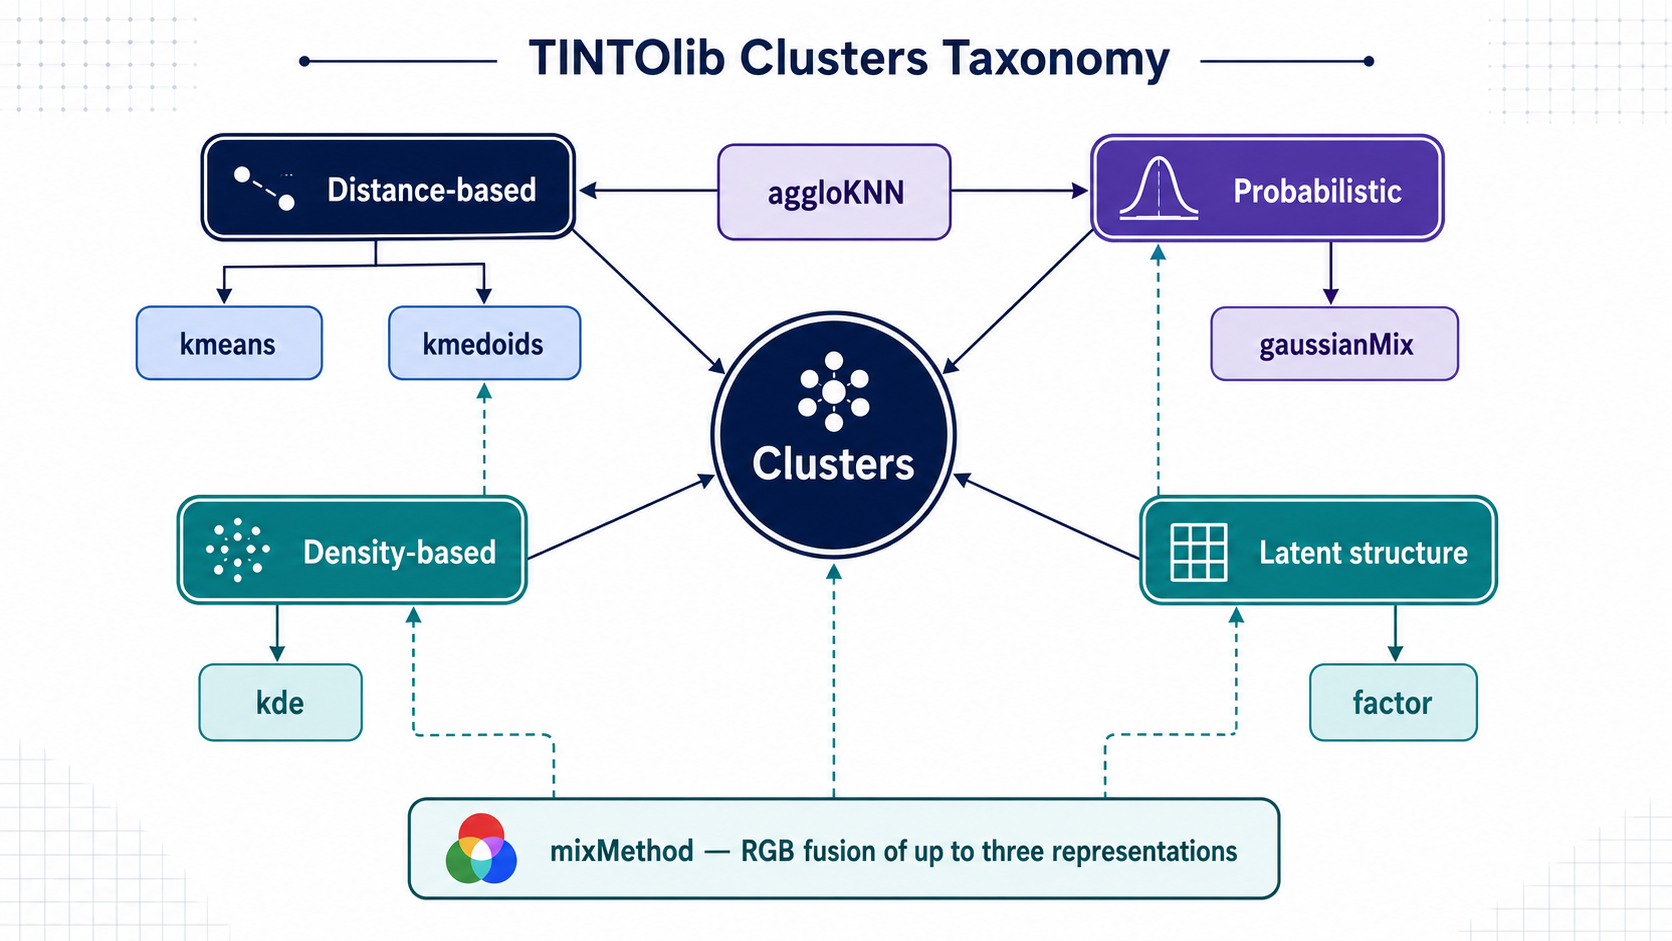
TINTOlib · Deep Learning · Tabular-to-Image
Introduction to TINTOlib
A Python framework for transforming tabular data into synthetic images and applying CNN-based vision architectures — bridging the gap between structured data and deep learning.
- Author: Manuel Castillo-Cara, PhD
- Affiliation: Dpt. of Artificial Intelligence, Universidad Nacional de Educación a Distancia (UNED), Spain
- Role: Researcher, Professor, and TINTOlib Python Library Developer
- License: CC BY-NC 4.0 unless otherwise stated.
TINTOlib overview videos
The following short videos provide a bilingual introduction to TINTOlib, explaining how tabular data can be transformed into synthetic images and processed with computer vision architectures such as CNNs, Vision Transformers and hybrid neural networks.
In contemporary Data Science, an established paradigm governs model selection: Deep Learning architectures dominate unstructured modalities such as computer vision and natural language processing, whereas gradient-boosted decision trees (GBDTs)—including XGBoost, LightGBM, and CatBoost—remain the gold standard for structured tabular datasets.
However, recent advancements in deep learning have challenged this dichotomy through the introduction of spatial encoding techniques. By transforming tabular features into synthetic multi-dimensional images, researchers can leverage the structural inductive biases of advanced computer vision networks, such as Convolutional Neural Networks (CNNs) and Vision Transformers (ViTs). This article provides a comprehensive theoretical and practical introduction to TINTOlib, the state-of-the-art Python library designed to streamline this transformation pipeline.
The Theoretical Framework: Why Map Tables to Images?
The primary impediment to directly applying CNNs to tabular datasets is the absence of spatial locality. In natural images, adjacent pixels exhibit strong semantic and structural correlations (e.g., forming edges, textures, and continuous geometric shapes). Conversely, rows and columns in a standard tabular matrix possess an arbitrary ordering; swapping column 2 and column $d$ changes the array indices but preserves the underlying data semantics. This structural format violates the spatial inductive bias—specifically, translation invariance and locality—upon which convolutional filters rely.
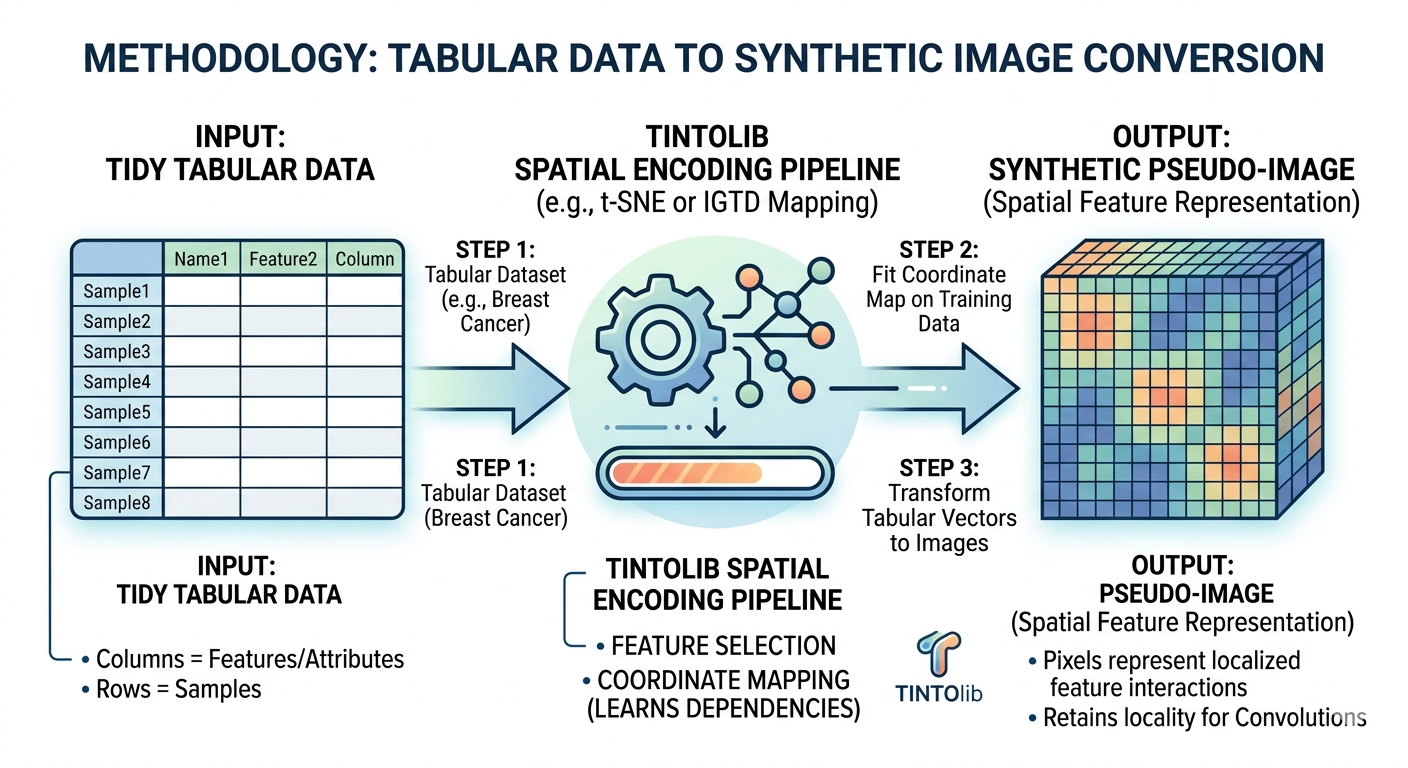
To overcome this limitation, spatial encoding methodologies project the feature space onto a discrete 2D coordinate system. Features that exhibit strong statistical correlations or mutual dependencies are mapped to proximal spatial coordinates within a synthetic “canvas,” generating a synthetic pseudo-image.
(Figure 1: Conceptual diagram illustrating the topological mapping of tabular feature vectors into a structured 2D pixel grid via TINTOlib spatial encoding).
Through this transformation, the vision model’s convolutional kernels can extract higher-order hierarchical feature interactions. Furthermore, this paradigm shifts tabular analysis from black-box numeric mapping to a visual space, enabling the direct integration of post-hoc Explainable AI (XAI) frameworks—such as Grad-CAM, SHAP, or PermGrad—to visually interpret feature attributions via saliency maps.
What is TINTOlib?
TINTOlib is an open-source Python framework that unifies a comprehensive suite of state-of-the-art tabular-to-image transformation algorithms under a single, cohesive, Scikit-Learn-compliant interface. For a comprehensive overview of the framework’s capabilities, consult the official TINTOlib Documentation.
Historically, evaluating different spatial encoding strategies required integrating disjointed, unstandardized repositories written across varying programming languages. TINTOlib resolves this fragmentation by categorizing and implementing both parametric and non-parametric approaches. While this tutorial focuses on the TINTO method (which utilizes manifold learning techniques like t-SNE or Principal Component Analysis to determine spatial feature positions), the library allows researchers to pivot to any other methodology—such as IGTD, REFINED, SuperTML, BarGraph, or Binary Image Encoding (BIE)—by modifying a single line of code, ensuring a seamless benchmarking experience.
Practical Implementation: Building Your First PyTorch CNN Pipeline
To demonstrate the efficacy of this paradigm, we will construct an end-to-end classification pipeline. To ensure strict reproducibility, we will utilize the standard Breast Cancer Wisconsin dataset from Scikit-Learn.
1. Spatial Encoding and Data Leakage Mitigation
A critical methodological vulnerability in spatial encoding is Data Leakage. Algorithms that learn the optimal spatial arrangement of pixels based on feature similarities (such as t-SNE, PCA, or distance-matrix optimizations) must never be exposed to the validation or testing partitions during the fitting phase. Doing so allows the topological properties of the unseen test data to influence the coordinate mapping, invalidating subsequent generalization metrics.
To ensure rigorous validation, the pipeline must strictly segregate data prior to mapping: call .fit() exclusively on the training partition to define the spatial configuration, and subsequently apply .transform() to generate the synthetic images for both sets independently.
import pandas as pd
from sklearn.datasets import load_breast_cancer
from sklearn.model_selection import train_test_split
from TINTOlib.tinto import TINTO

# 1. Load the structured tabular dataset (Breast Cancer - 30 numeric features)
raw_data = load_breast_cancer()
df = pd.DataFrame(raw_data.data, columns=raw_data.feature_names)
# Append the target variable as the final column, conforming to tidy data standards
df['target'] = raw_data.target

# 2. Partition the dataset to guarantee strict validation boundaries
X_train, X_test = train_test_split(df, test_size=0.2, random_state=42)

# 3. Instantiate the spatial encoder (TINTO via t-SNE optimization, outputting a 20x20 canvas)
# Note: To alternate methods, simply import and instantiate IGTD or REFINED here.
encoder = TINTO(problem="supervised", algorithm="t-SNE", pixels=20, blur=True)

# 4. Fit the spatial coordinate mapping matrix ONLY using the training split
encoder.fit(X_train)

# 5. Transform the tabular matrices into synthetic image repositories
encoder.transform(X_train, "synthetic_dataset/train/")
encoder.transform(X_test, "synthetic_dataset/test/")
print("Transformation completed successfully. Spatial representations isolated.")


(Figure 2. Synthetic image samples generated with TINTOlib using the TINTO method with blurring. Each image corresponds to an individual tabular instance from the Breast Cancer Wisconsin dataset and encodes its feature values into a two-dimensional spatial representation. The resulting intensity patterns can be processed by CNN-based and hybrid neural architectures.)
2. Architectural Specification in PyTorch
Following image generation, we construct a standard Convolutional Neural Network tailored to ingest the single-channel (grayscale) $20 \times 20$ pixel representations yielded by TINTOlib.
import torch
import torch.nn as nn
import torch.nn.functional as F

class TabularCNN(nn.Module):
    def __init__(self, num_classes=2):
        super(TabularCNN, self).__init__()

        # Convolutional Block 1: Input channels = 1, Output feature maps = 32
        self.conv1 = nn.Conv2d(in_channels=1, out_channels=32, kernel_size=3, padding=1)
        self.pool1 = nn.MaxPool2d(kernel_size=2, stride=2)

        # Convolutional Block 2: Input channels = 32, Output feature maps = 64
        self.conv2 = nn.Conv2d(in_channels=32, out_channels=64, kernel_size=3, padding=1)
        self.pool2 = nn.MaxPool2d(kernel_size=2, stride=2)

        # Given a 20x20 input, two successive MaxPool reductions yield a 5x5 spatial size
        self.flatten = nn.Flatten()
        self.fc1 = nn.Linear(64 * 5 * 5, 128)
        self.fc2 = nn.Linear(128, num_classes)

    def forward(self, x):
        # Block 1 forward pass
        x = self.pool1(F.relu(self.conv1(x)))
        # Block 2 forward pass
        x = self.pool2(F.relu(self.conv2(x)))
        # Classification head
        x = self.flatten(x)
        x = F.relu(self.fc1(x))
        x = self.fc2(x)
        return x

# Instantiate the model architecture for binary classification
vision_model = TabularCNN(num_classes=2)
print(vision_model)
The generated synthetic images stored in synthetic_dataset/ can be seamlessly loaded via PyTorch’s standard torchvision.datasets.ImageFolder class combined with a DataLoader loop, optimizing models using typical criteria like CrossEntropyLoss or BCEWithLogitsLoss.
Conclusion and Open Horizons
Transforming tabular features into synthetic spatial layouts offers a compelling methodology to bridge classical data problems with state-of-the-art visual architectures. Utilizing TINTOlib provides data scientists with a rigorous, reproducible, and standardized framework to systematically test, compare, and scale these transformations while avoiding common pitfalls such as data leakage.
In subsequent entries, we will delve deeper into benchmarking comparative analysis (e.g., non-parametric IGTD vs. parallelized REFINED), evaluating performance shifts when deploying Vision Transformers (ViTs), and rendering feature importance maps through advanced XAI methods.
References and related publications
The concepts presented in this tutorial are connected to the following research and software publications on TINTO, TINTOlib, tabular-to-image transformation, synthetic spatial representations, hybrid neural networks, and indoor localisation.
Research articles
Jiayun Liu, Manuel Castillo-Cara, Raúl García-Castro, Luis Orozco-Barbosa. Interpretable Hybrid Vision Transformer Architectures for MIMO-Based Indoor Localization using Synthetic Spatial Representations. IEEE Internet of Things. DOI: 10.1109/JIOT.2026.3696106
Jiayun Liu, Manuel Castillo-Cara, Raúl García-Castro. A Comprehensive Benchmark of Spatial Encoding Methods for Tabular Data with Deep Neural Networks. Information Fusion. DOI: 10.1016/j.inffus.2025.104088
Giovanny Mondragon-Ruiz, Jiayun Liu, Manuel Castillo-Cara, Raúl García-Castro. Interpretable CNN–KAN hybrid architectures for tabular data with synthetic image encoding. Information Processing and Management. DOI: 10.1016/j.ipm.2026.104954
Felipe Escalera-González, Manuel Castillo-Cara, Mariano Rincón-Zamorano, Luis Orozco-Barbosa. PermGrad: Interpretable Hybrid Neural Networks with synthetic images for tabular data. Knowledge-Based Systems. DOI: 10.1016/j.knosys.2026.116507
Manuel Castillo-Cara, Jesus Martínez-Gómez, Javier Ballesteros-Jerez, Ismael García-Varea, Raúl García-Castro, Luis Orozco-Barbosa. MIMO-Based Indoor Localisation with Hybrid Neural Networks. IEEE Journal of Selected Topics in Signal Processing. DOI: 10.1109/JSTSP.2025.3555067
Reewos Talla-Chumpitaz, Manuel Castillo-Cara, Luis Orozco-Barbosa, Raúl García-Castro. Blurring Image Techniques for Bluetooth-based Indoor Localisation. Information Fusion. DOI: 10.1016/j.inffus.2022.10.011
Software articles
Jiayun Liu, David González-Fernández, Manuel Castillo-Cara, Raúl García-Castro. TINTOlib: A Python library for transforming tabular data into synthetic images for deep neural networks. SoftwareX. DOI: 10.1016/j.softx.2025.102444
Manuel Castillo-Cara, Reewos Talla-Chumpitaz, Raúl García-Castro, Luis Orozco-Barbosa. TINTO: Converting Tidy Data into Image for Classification with 2-Dimensional Convolutional Neural Networks. SoftwareX. DOI: 10.1016/j.softx.2023.101391
Continue learning Artificial Intelligence
Explore practical courses on AI, Machine Learning, Deep Learning, Python, R and applied data science.

© Manuel Castillo-Cara, PhD. Content licensed under CC BY-NC 4.0 unless otherwise stated.